2025 ART Price Prediction: Analyzing Market Trends and Potential Growth Factors
Introduction: ART's Market Position and Investment Value
LiveArt (ART), as an AI-powered RWAfi protocol unlocking the $10T market of investment-grade art and collectibles, has achieved significant milestones since its inception. As of 2025, ART's market capitalization has reached $465,270, with a circulating supply of approximately 130,000,000 tokens, and a price hovering around $0.003579. This asset, often referred to as the "Cultural Wealth Tokenizer," is playing an increasingly crucial role in transforming blue-chip assets into liquid, programmable financial instruments.
This article will comprehensively analyze ART's price trends from 2025 to 2030, combining historical patterns, market supply and demand, ecosystem development, and macroeconomic factors to provide investors with professional price predictions and practical investment strategies.
I. ART Price History Review and Current Market Status
ART Historical Price Evolution
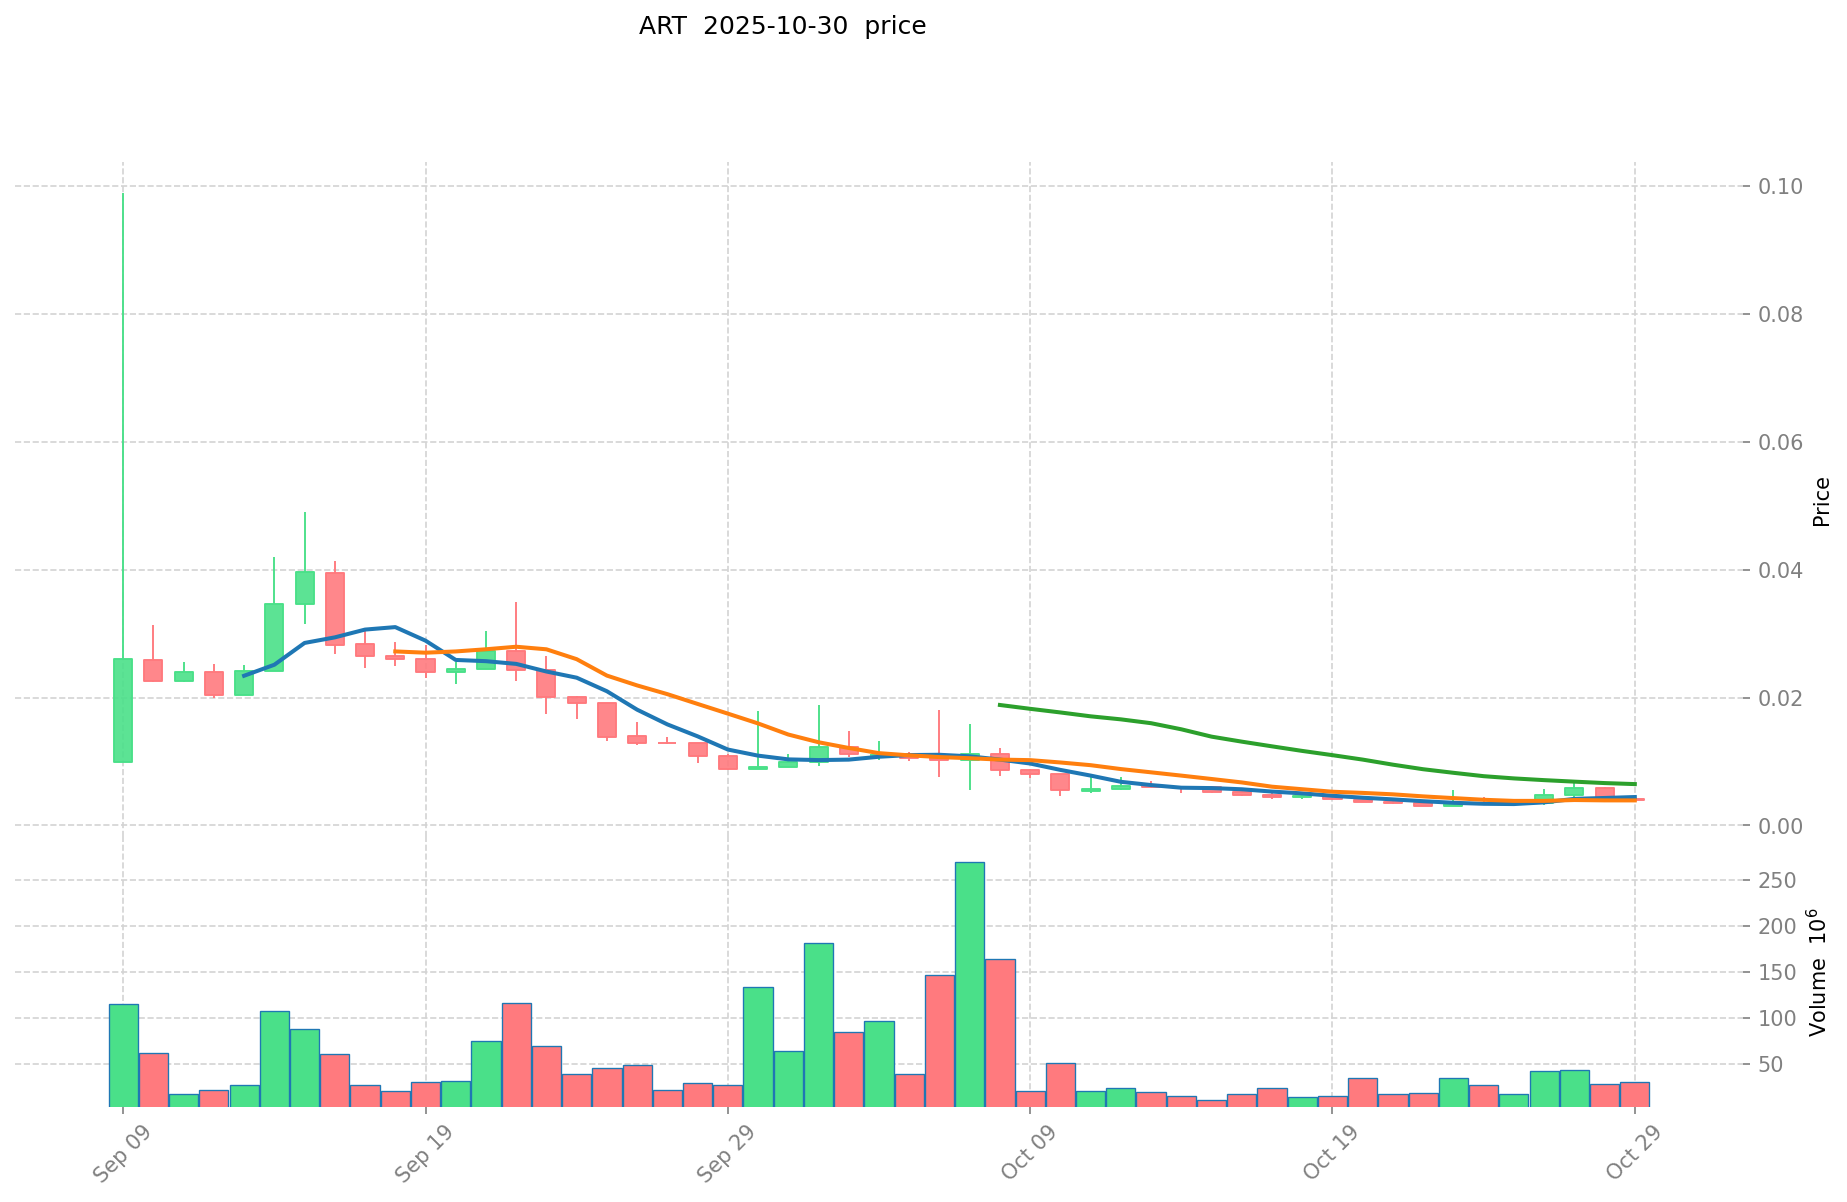
- 2025 September: ART reached its all-time high of $0.099, marking a significant milestone for the project
- 2025 October: The market experienced a sharp downturn, with ART's price dropping to its all-time low of $0.003002
- 2025 October 30: ART's price has shown signs of recovery, rising from its recent low
ART Current Market Situation
As of October 30, 2025, ART is trading at $0.003579, with a 24-hour trading volume of $107,308.20. The token has experienced a significant decline of 14.46% in the past 24 hours. ART's market capitalization stands at $465,270, ranking it at 3512 in the cryptocurrency market. The current price represents a 96.38% decrease from its all-time high and a 19.22% increase from its all-time low. The circulating supply of ART is 130,000,000 tokens, which is 13% of its total supply of 1,000,000,000 tokens. The market sentiment appears bearish in the short term, with a 3.75% decrease in the last hour and a 61.18% drop over the past 30 days. However, there's a slight positive momentum in the 7-day timeframe, showing a 4.24% increase.
Click to view the current ART market price
ART Market Sentiment Indicator
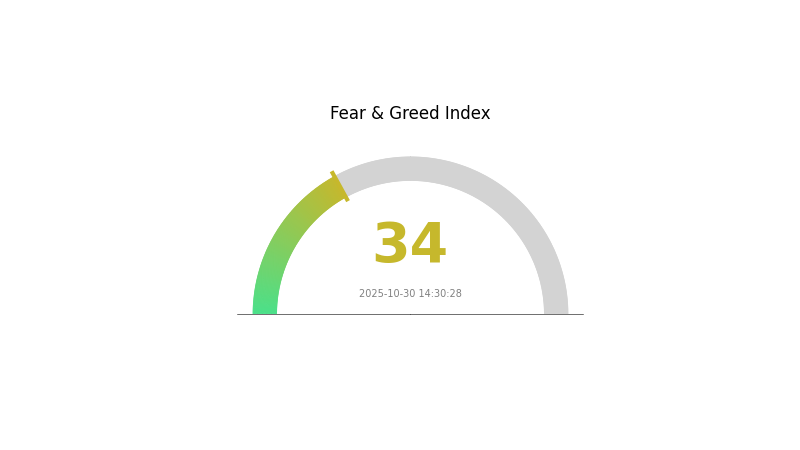
2025-10-30 Fear and Greed Index: 34 (Fear)
Click to view the current Fear & Greed Index
The crypto market continues to exhibit signs of fear, with the Fear and Greed Index standing at 34. This cautious sentiment suggests investors are wary of potential risks. However, for contrarian traders, periods of fear often present buying opportunities. As always, it's crucial to conduct thorough research and manage risk effectively. Remember, market sentiment can shift rapidly, and staying informed is key to navigating these volatile waters.
ART Holdings Distribution
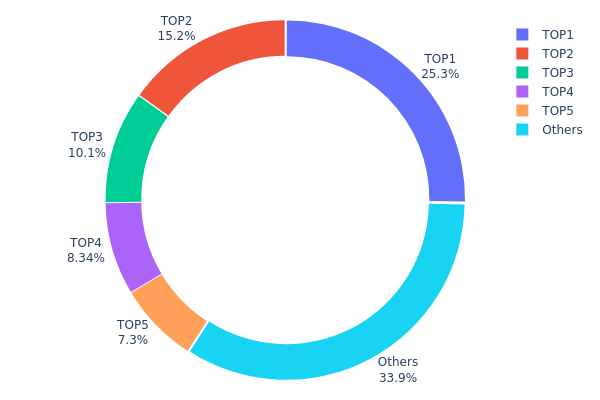
The address holdings distribution data provides crucial insights into the concentration of ART tokens among different wallet addresses. Analysis of this data reveals a significant concentration of ART tokens among the top holders. The top address holds 25.25% of the total supply, with the top five addresses collectively controlling 66.13% of all ART tokens.
This high concentration raises concerns about potential market manipulation and volatility. With such a large portion of tokens held by a few addresses, any significant movement from these wallets could dramatically impact the token's price and liquidity. Furthermore, this concentration may undermine the project's decentralization efforts, as a small group of holders wield substantial influence over the token's ecosystem.
Despite these concerns, it's worth noting that 33.87% of ART tokens are distributed among other addresses, indicating some level of broader market participation. However, the current distribution structure suggests a need for increased token dispersion to enhance market stability and reduce manipulation risks.
Click to view the current ART Holdings Distribution
| Top | Address | Holding Qty | Holding (%) |
|---|---|---|---|
| 1 | 0xbe58...6e389e | 250000.00K | 25.25% |
| 2 | 0x61bf...789694 | 150000.00K | 15.15% |
| 3 | 0x19f7...6b7ea1 | 100000.00K | 10.10% |
| 4 | 0x9135...6490ed | 82551.71K | 8.33% |
| 5 | 0x3832...7c1559 | 72282.53K | 7.30% |
| - | Others | 335164.35K | 33.87% |
II. Key Factors Influencing ART's Future Price
Supply Mechanism
- Staking and lock-up mechanism: As the ecosystem develops, more assets are tokenized and traded on secondary markets, and the staking lock-up mechanism deepens, the utility demand and scarcity of ART are expected to increase.
Macroeconomic Environment
- Monetary policy impact: The market generally expects the Federal Reserve to continue its rate-cutting cycle in 2025, which may weaken the opportunity cost of holding ART as real interest rates decline.
- Inflation hedging properties: In an inflationary environment, ART may be viewed as a potential hedge against inflation, similar to gold.
- Geopolitical factors: Ongoing geopolitical risks and trade tensions may impact global markets and potentially increase demand for alternative assets like ART.
Technological Development and Ecosystem Building
- Ecosystem expansion: The continuous development of the LiveArt ecosystem, including the tokenization of more assets and their trading on secondary markets, is likely to drive demand for ART.
III. ART Price Prediction for 2025-2030
2025 Outlook
- Conservative forecast: $0.00203 - $0.00356
- Neutral forecast: $0.00356 - $0.00372
- Optimistic forecast: $0.00372 - $0.00388 (requires positive market sentiment)
2027-2028 Outlook
- Market phase expectation: Potential growth phase
- Price range forecast:
- 2027: $0.00443 - $0.00563
- 2028: $0.00348 - $0.00604
- Key catalysts: Increased adoption, technological advancements
2030 Long-term Outlook
- Base scenario: $0.00334 - $0.00631 (assuming steady market growth)
- Optimistic scenario: $0.00631 - $0.00675 (assuming strong market performance)
- Transformative scenario: $0.00675+ (assuming exceptional market conditions and widespread adoption)
- 2030-12-31: ART $0.00675 (potential peak price)
| 年份 | 预测最高价 | 预测平均价格 | 预测最低价 | 涨跌幅 |
|---|---|---|---|---|
| 2025 | 0.00388 | 0.00356 | 0.00203 | 1 |
| 2026 | 0.00551 | 0.00372 | 0.00275 | 5 |
| 2027 | 0.00563 | 0.00461 | 0.00443 | 30 |
| 2028 | 0.00604 | 0.00512 | 0.00348 | 45 |
| 2029 | 0.00703 | 0.00558 | 0.00329 | 58 |
| 2030 | 0.00675 | 0.00631 | 0.00334 | 78 |
IV. Professional Investment Strategies and Risk Management for ART
ART Investment Methodology
(1) Long-term Holding Strategy
- Suitable for: Long-term investors interested in the RWAfi sector
- Operational advice:
- Accumulate ART tokens during market dips
- Stay informed about LiveArt's developments and partnerships
- Store tokens securely in a non-custodial wallet
(2) Active Trading Strategy
- Technical Analysis Tools:
- Moving Averages: Use to identify trends and potential reversal points
- Relative Strength Index (RSI): Monitor overbought/oversold conditions
- Key Points for Swing Trading:
- Monitor ART's correlation with the broader crypto market
- Set strict stop-loss orders to manage downside risk
ART Risk Management Framework
(1) Asset Allocation Principles
- Conservative investors: 1-3% of crypto portfolio
- Moderate investors: 3-5% of crypto portfolio
- Aggressive investors: 5-10% of crypto portfolio
(2) Risk Hedging Solutions
- Diversification: Spread investments across various RWAfi projects
- Stop-loss orders: Implement to limit potential losses
(3) Secure Storage Solutions
- Hot wallet recommendation: Gate Web3 Wallet
- Cold storage solution: Hardware wallet for long-term holdings
- Security precautions: Enable two-factor authentication, use strong passwords
V. Potential Risks and Challenges for ART
ART Market Risks
- Volatility: ART price may experience significant fluctuations
- Liquidity: Limited trading volume may impact entry/exit positions
- Market sentiment: Shifts in crypto market sentiment can affect ART's performance
ART Regulatory Risks
- RWAfi regulations: Potential new regulations may impact LiveArt's operations
- Cross-border compliance: Challenges in adhering to various international laws
- Token classification: Uncertainty regarding ART's regulatory status in different jurisdictions
ART Technical Risks
- Smart contract vulnerabilities: Potential for exploits or bugs in the protocol
- Blockchain scalability: Base network congestion may affect transaction speeds
- Integration issues: Challenges in connecting real-world assets to the blockchain
VI. Conclusion and Action Recommendations
ART Investment Value Assessment
ART represents a unique opportunity in the emerging RWAfi sector, with potential for long-term growth. However, investors should be aware of the high volatility and regulatory uncertainties in the short term.
ART Investment Recommendations
✅ Beginners: Start with small positions and focus on education about RWAfi ✅ Experienced investors: Consider allocating a portion of portfolio to ART as part of a diversified strategy ✅ Institutional investors: Conduct thorough due diligence and consider ART for exposure to the RWAfi market
ART Trading Participation Methods
- Spot trading: Buy and sell ART tokens on Gate.com
- DeFi participation: Explore yield-generating opportunities within the LiveArt ecosystem
- Long-term holding: Accumulate ART tokens for potential future value appreciation
Cryptocurrency investments carry extremely high risks, and this article does not constitute investment advice. Investors should make decisions carefully based on their own risk tolerance and are advised to consult professional financial advisors. Never invest more than you can afford to lose.
FAQ
What crypto has the highest price prediction?
As of 2025, Ethereum has the highest price prediction among major cryptocurrencies, based on technological advancements and market trends.
Will the graph reach $10?
While The Graph has potential, reaching $10 is uncertain. Its future price depends on adoption rates and overall market conditions in the crypto space.
How much will Fetch AI be worth in 2030?
Based on current projections, Fetch AI is expected to reach a value of $16.23 by 2030.
What is the price prediction for live art?
Live art price is predicted to reach $0.0245 by 2034, with analysts expecting $0.0273 by 2031. The maximum price is forecasted at $0.0389 by 2032.
Share
Content
Introduction: ART's Market Position and Investment Value
I. ART Price History Review and Current Market Status
II. Key Factors Influencing ART's Future Price
III. ART Price Prediction for 2025-2030
IV. Professional Investment Strategies and Risk Management for ART
V. Potential Risks and Challenges for ART
VI. Conclusion and Action Recommendations
FAQ

