2025 BMON Price Prediction: Will This Gaming Token Reach New Heights in the Metaverse Era?
Introduction: BMON's Market Position and Investment Value
Binamon (BMON), as a complete digital monster meta space on the BSC, has been making strides in the NFT and gaming sectors since its inception. As of 2025, BMON's market capitalization stands at $449,484.81, with a circulating supply of approximately 170,194,929 tokens, and a price hovering around $0.002641. This asset, often referred to as a "metaverse gaming token," is playing an increasingly crucial role in the blockchain gaming and NFT marketplace.
This article will provide a comprehensive analysis of BMON's price trends from 2025 to 2030, considering historical patterns, market supply and demand, ecosystem development, and the macroeconomic environment to offer professional price predictions and practical investment strategies for investors.
I. BMON Price History Review and Current Market Status
BMON Historical Price Evolution
- 2021: BMON reached its all-time high of $0.813157 on August 23, marking a significant milestone in its early trading history.
- 2023: The token experienced a severe downturn, hitting its all-time low of $0.00228684 on October 14, reflecting broader market challenges.
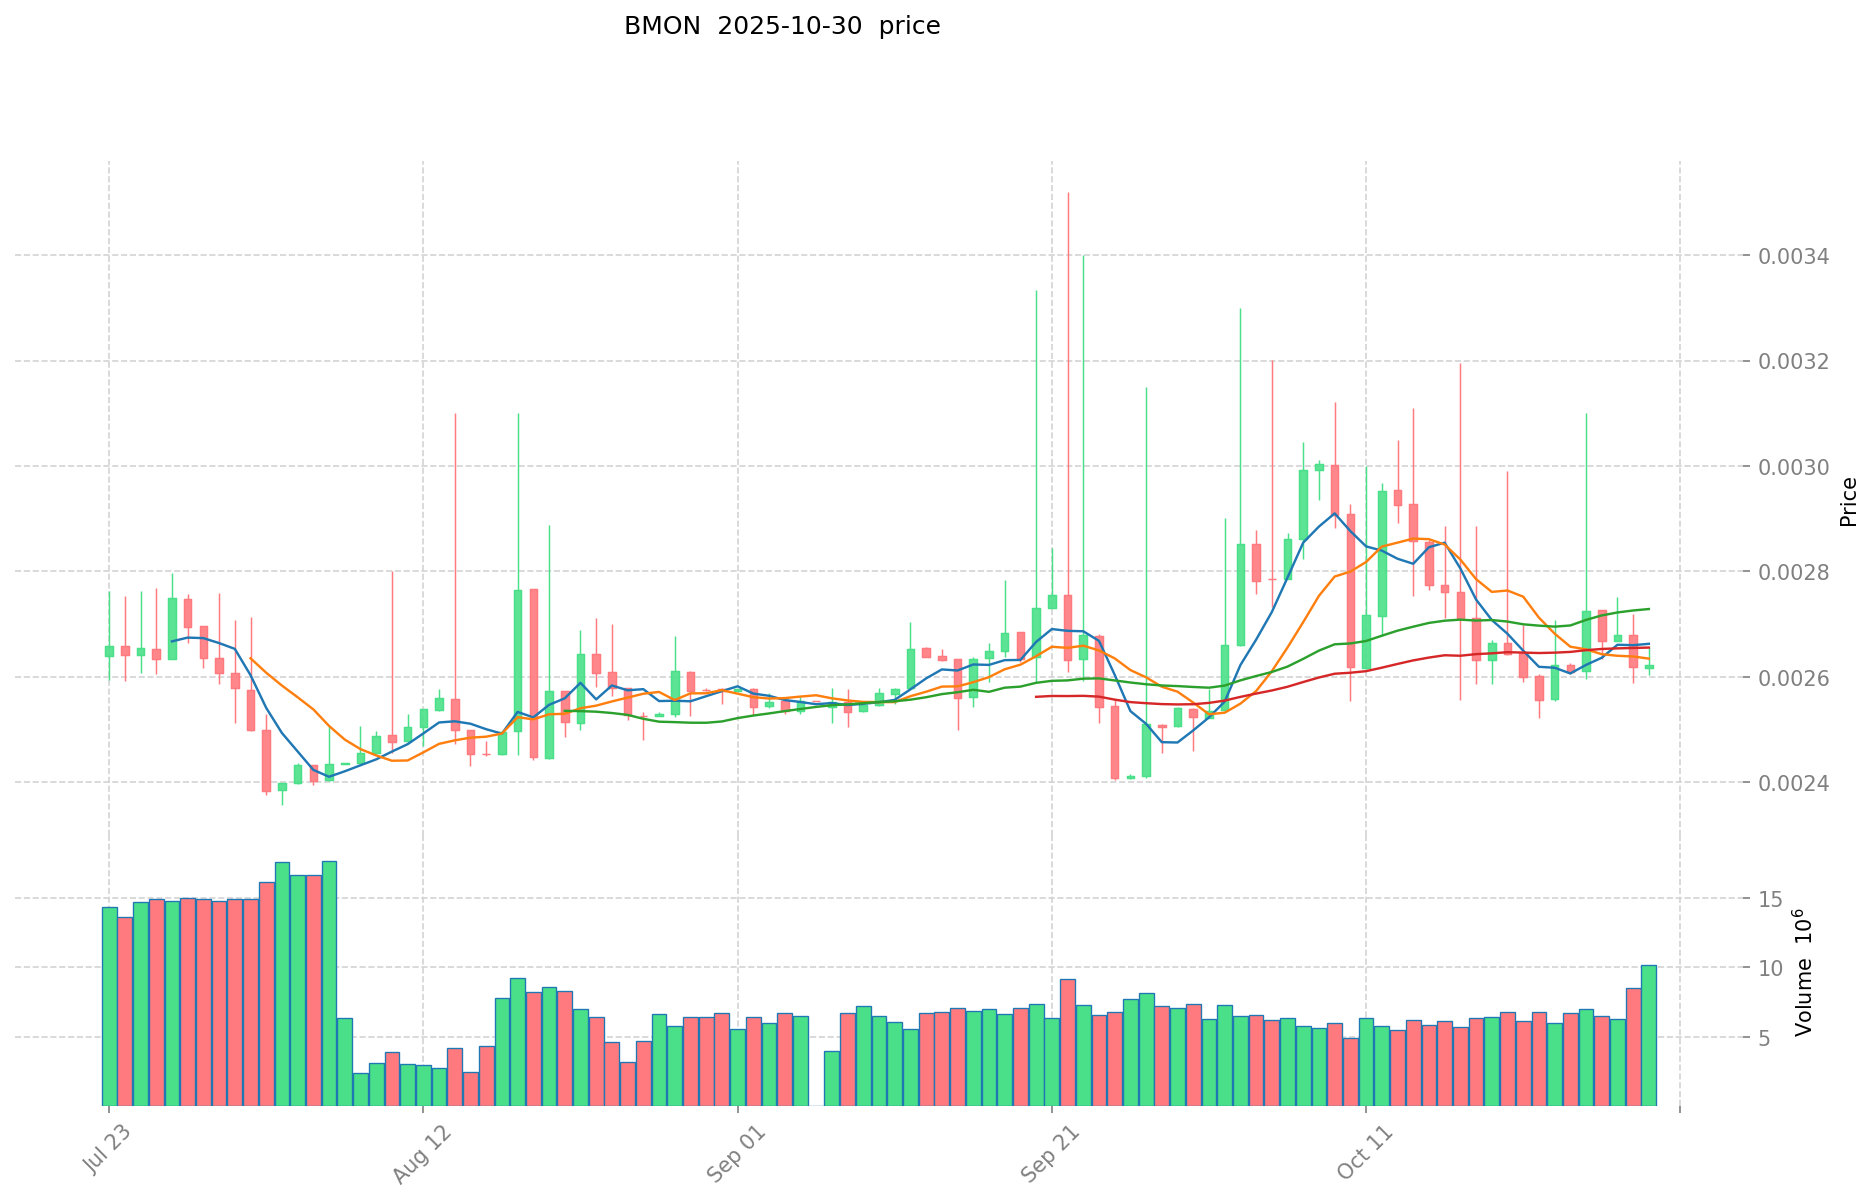
- 2025: BMON has shown signs of recovery, with the price currently stabilizing around $0.002641.
BMON Current Market Situation
As of October 31, 2025, BMON is trading at $0.002641, representing a 0.68% increase in the last 24 hours. The token's market capitalization stands at $449,484, ranking it 3538th in the overall cryptocurrency market. BMON has seen a 4.76% increase over the past 30 days, indicating a positive short-term trend. However, the annual performance shows a significant decline of -44.16%, suggesting that BMON is still far from its historical peak.
The current circulating supply of BMON is 170,194,929 tokens, which is 56.73% of its maximum supply of 300,000,000. This indicates that there is still a substantial portion of tokens to be released into circulation, potentially impacting future price dynamics.
Trading volume in the last 24 hours reached $19,275, reflecting moderate market activity. The token's fully diluted valuation is $792,300, showcasing the theoretical market cap if the maximum supply were in circulation.
Click to view the current BMON market price
BMON Market Sentiment Indicator
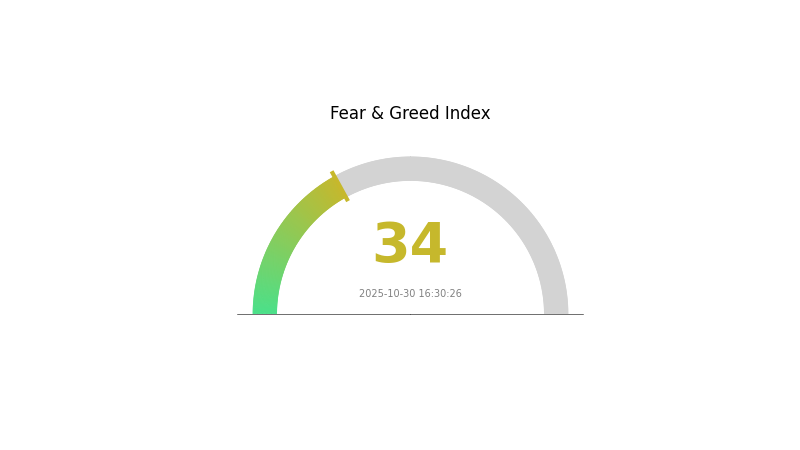
2025-10-30 Fear and Greed Index: 34 (Fear)
Click to view the current Fear & Greed Index
The crypto market sentiment remains cautious as the Fear and Greed Index hovers at 34, indicating a fearful atmosphere. This suggests investors are hesitant and potentially looking for buying opportunities. While fear can signal a good time to enter the market, it's crucial to conduct thorough research and manage risks carefully. Remember, market sentiment can shift quickly, so stay informed and consider diversifying your portfolio on platforms like Gate.com to navigate these uncertain times.
BMON Holdings Distribution
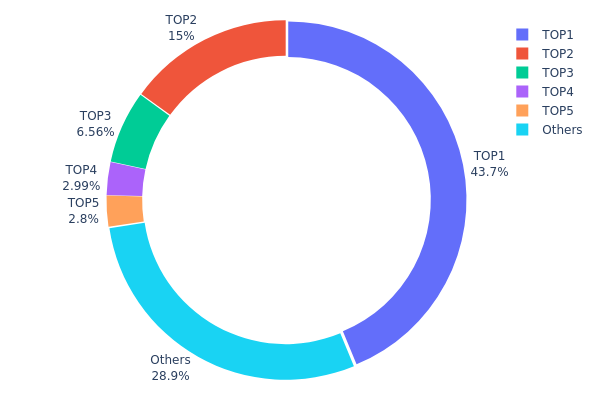
The address holdings distribution for BMON reveals a highly concentrated ownership structure. The top address holds a substantial 43.74% of the total supply, equivalent to 100,000,000K BMON tokens. This is followed by the second-largest holder with 15.03%, and the third with 6.56%. Collectively, the top five addresses control 71.11% of the total BMON supply, indicating a significant concentration of tokens in a few hands.
This level of concentration raises concerns about market stability and potential price manipulation. With such a large portion of tokens held by a small number of addresses, there is an increased risk of market volatility should these major holders decide to sell or move their assets. Furthermore, this concentration may impact the token's liquidity and could potentially allow for market manipulation by these large holders.
The current distribution suggests a low level of decentralization for BMON, which may be a point of concern for investors seeking a more distributed token economy. This concentration could also affect governance decisions if BMON implements any on-chain voting mechanisms, as the large holders would have disproportionate influence over the project's direction.
Click to view the current BMON Holdings Distribution
| Top | Address | Holding Qty | Holding (%) |
|---|---|---|---|
| 1 | 0x0c89...518820 | 100000.00K | 43.74% |
| 2 | 0x7536...d9a85c | 34375.00K | 15.03% |
| 3 | 0x3c2b...2bf108 | 15004.19K | 6.56% |
| 4 | 0x10d3...f9b711 | 6830.21K | 2.98% |
| 5 | 0x0d07...b492fe | 6406.31K | 2.80% |
| - | Others | 66004.19K | 28.89% |
II. Key Factors Affecting BMON's Future Price
Supply Mechanism
- Market Demand: The price trend of BMON is directly influenced by market demand, which can fluctuate based on various factors such as user adoption and overall market conditions.
- Historical Pattern: Supply and demand changes have historically been a significant driver of BMON's price movements.
- Current Impact: Any changes in the supply dynamics are expected to have a direct impact on BMON's future price.
Macroeconomic Environment
- Inflation Hedging Properties: As with many cryptocurrencies, BMON's performance in an inflationary environment could be a factor in its price movement.
Technological Development and Ecosystem Building
- Technical Innovation: Technological advancements and innovations within the BMON project are crucial factors that can significantly influence its future price.
- Ecosystem Applications: The development of DApps and other ecosystem projects related to BMON could play a vital role in driving its adoption and, consequently, its price.
III. BMON Price Prediction for 2025-2030
2025 Outlook
- Conservative forecast: $0.00253 - $0.00263
- Neutral forecast: $0.00263 - $0.00294
- Optimistic forecast: $0.00294 - $0.00334 (requires favorable market conditions)
2026-2027 Outlook
- Market phase expectation: Potential growth phase
- Price range forecast:
- 2026: $0.00230 - $0.00361
- 2027: $0.00198 - $0.00462
- Key catalysts: Increased adoption and project developments
2028-2030 Long-term Outlook
- Base scenario: $0.00396 - $0.00490 (assuming steady market growth)
- Optimistic scenario: $0.00490 - $0.00541 (with strong project performance)
- Transformative scenario: Above $0.00541 (with breakthrough innovations)
- 2030-12-31: BMON $0.00510 (potential peak value)
| 年份 | 预测最高价 | 预测平均价格 | 预测最低价 | 涨跌幅 |
|---|---|---|---|---|
| 2025 | 0.00334 | 0.00263 | 0.00253 | 0 |
| 2026 | 0.00361 | 0.00299 | 0.0023 | 13 |
| 2027 | 0.00462 | 0.0033 | 0.00198 | 24 |
| 2028 | 0.00483 | 0.00396 | 0.00309 | 49 |
| 2029 | 0.00541 | 0.0044 | 0.00427 | 66 |
| 2030 | 0.0051 | 0.0049 | 0.00456 | 85 |
IV. BMON Professional Investment Strategies and Risk Management
BMON Investment Methodology
(1) Long-term Holding Strategy
- Suitable for: Long-term investors with high risk tolerance
- Operation suggestions:
- Accumulate BMON tokens during market dips
- Hold for at least 1-2 years to ride out market volatility
- Store tokens in a secure non-custodial wallet
(2) Active Trading Strategy
- Technical analysis tools:
- Moving Averages: Use to identify trends and potential entry/exit points
- RSI: Monitor overbought/oversold conditions
- Key points for swing trading:
- Set stop-loss orders to limit potential losses
- Take profits at predetermined price targets
BMON Risk Management Framework
(1) Asset Allocation Principles
- Conservative investors: 1-3% of crypto portfolio
- Aggressive investors: 5-10% of crypto portfolio
- Professional investors: Up to 15% of crypto portfolio
(2) Risk Hedging Solutions
- Diversification: Spread investments across multiple crypto assets
- Stop-loss orders: Implement to limit potential losses
(3) Secure Storage Solutions
- Hot wallet recommendation: Gate Web3 Wallet
- Cold storage solution: Hardware wallet for long-term holding
- Security precautions: Enable two-factor authentication, use strong passwords
V. Potential Risks and Challenges for BMON
BMON Market Risks
- High volatility: Price can experience significant fluctuations
- Limited liquidity: May face challenges in executing large trades
- Competition: Other NFT gaming projects may impact market share
BMON Regulatory Risks
- Uncertain regulatory environment: Potential for new regulations affecting NFTs
- Cross-border compliance: Varying legal status in different jurisdictions
- Tax implications: Unclear tax treatment of NFT-related transactions
BMON Technical Risks
- Smart contract vulnerabilities: Potential for exploits or bugs
- Scalability issues: May face challenges with network congestion
- Dependency on BSC: Risks associated with the underlying blockchain
VI. Conclusion and Action Recommendations
BMON Investment Value Assessment
BMON offers exposure to the growing NFT gaming sector but carries significant risks due to its low market cap and high volatility. Long-term potential exists if the Binamon ecosystem expands, but short-term price movements may be unpredictable.
BMON Investment Recommendations
✅ Beginners: Consider small, experimental positions after thorough research
✅ Experienced investors: Implement strict risk management and diversify holdings
✅ Institutional investors: Conduct deep due diligence and consider as part of a broader NFT/gaming portfolio
BMON Trading Participation Methods
- Spot trading: Available on Gate.com for direct BMON/USDT pairs
- NFT trading: Explore Binamon's native marketplace for NFT-based gameplay
- Staking: Participate in any available staking programs for passive income
Cryptocurrency investments carry extremely high risks, and this article does not constitute investment advice. Investors should make decisions carefully based on their own risk tolerance and are advised to consult professional financial advisors. Never invest more than you can afford to lose.
FAQ
Can Monero reach $1000?
Yes, Monero could potentially reach $1000. This would require strong market demand and favorable conditions. While possible, it's not guaranteed and depends on various factors in the crypto market.
Is banana a good crypto?
No, banana is not a good crypto. It lacks popularity and market traction, resulting in its failure as a viable cryptocurrency.
Will BNB hit 1000?
BNB has strong potential to reach $1000 by 2026-2027, driven by utility and market dominance. Predictions suggest it could exceed this mark. Current projections are optimistic.
Will Mana reach $20?
Based on analyst predictions, MANA could reach $20 by the end of 2025, driven by increased adoption and growth in the metaverse sector.
Share
Content
Introduction: BMON's Market Position and Investment Value
I. BMON Price History Review and Current Market Status
II. Key Factors Affecting BMON's Future Price
III. BMON Price Prediction for 2025-2030
IV. BMON Professional Investment Strategies and Risk Management
V. Potential Risks and Challenges for BMON
VI. Conclusion and Action Recommendations
FAQ

