2025 K21 Price Prediction: Analyzing Market Trends and Future Prospects for the Emerging Cryptocurrency
Introduction: K21's Market Position and Investment Value
K21 (K21), as a token representing partial ownership of a curated art collection, has made significant strides since its inception in 2021. As of 2025, K21's market capitalization stands at $681,949.98, with a circulating supply of approximately 18,026,697 tokens, and a price hovering around $0.03783. This asset, often referred to as an "art-backed digital token," is playing an increasingly crucial role in the intersection of blockchain technology and fine art.
This article will provide a comprehensive analysis of K21's price trends from 2025 to 2030, taking into account historical patterns, market supply and demand, ecosystem development, and macroeconomic factors, to offer professional price predictions and practical investment strategies for investors.
I. K21 Price History Review and Current Market Status
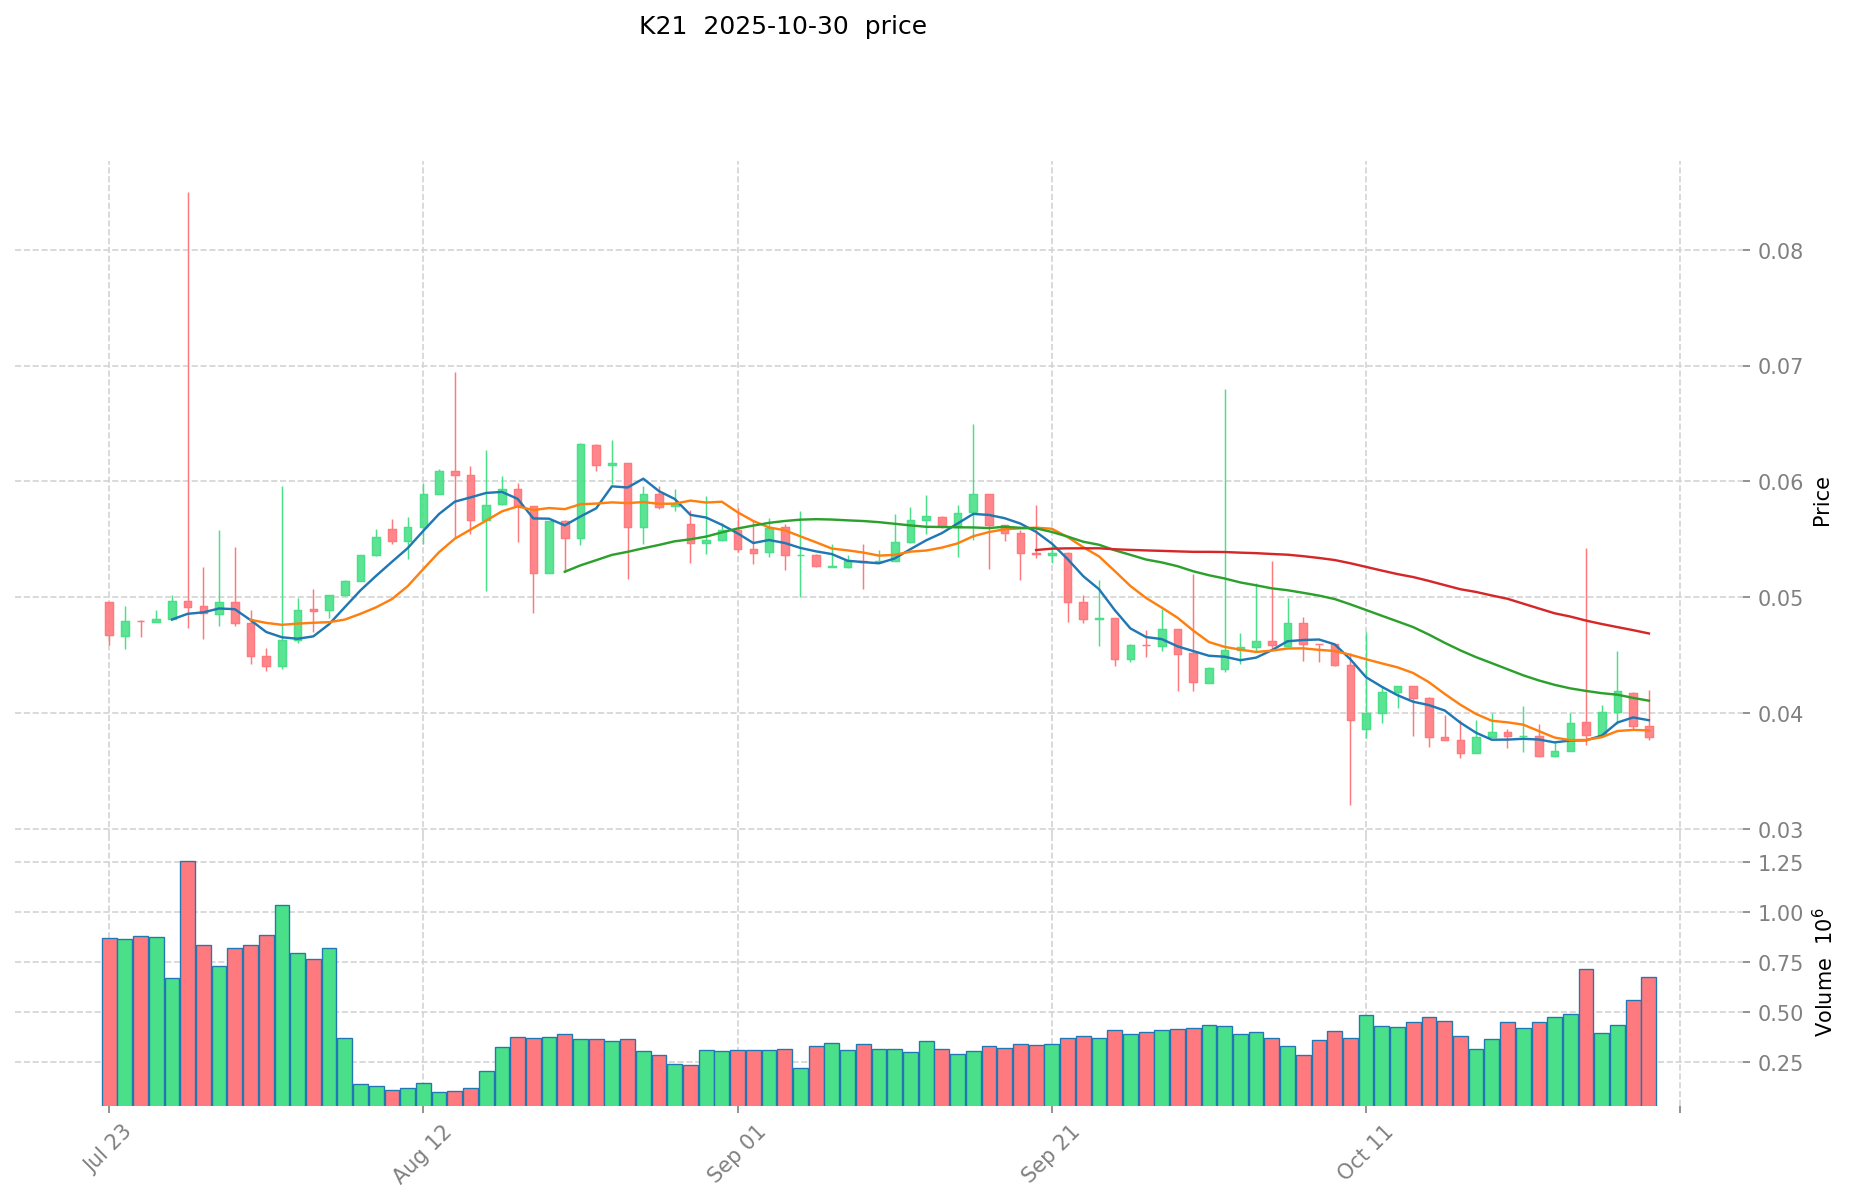
K21 Historical Price Evolution
- 2021: Initial launch, price reached all-time high of $11.59 on March 27
- 2022-2024: Gradual price decline during bear market conditions
- 2025: Price hit all-time low of $0.02374923 on April 9, followed by slight recovery
K21 Current Market Situation
K21 is currently trading at $0.03783, down 2.29% in the last 24 hours. The token has shown mixed performance across different timeframes, with a 4.33% increase over the past week but a 16.21% decrease over the last 30 days. The long-term trend remains bearish, with a 41.02% decline over the past year.
The current market capitalization stands at $681,949.98, ranking K21 at 3175th position in the overall cryptocurrency market. With a circulating supply of 18,026,697.92 K21 tokens out of a total supply of 21,000,000, the token has a circulating ratio of 85.84%.
Trading volume in the last 24 hours reached $26,518.93, indicating moderate market activity. The current price is significantly below the all-time high, suggesting potential for recovery if market conditions improve and project developments gain traction.
Click to view the current K21 market price
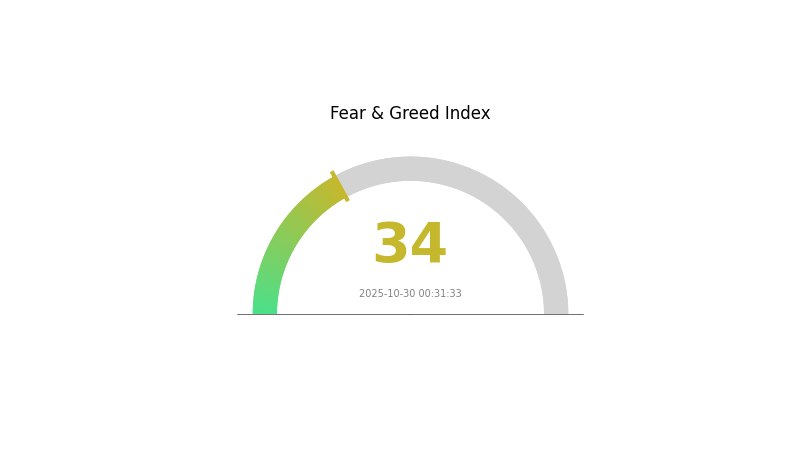
K21 Market Sentiment Indicator
2025-10-30 Fear and Greed Index: 34 (Fear)
Click to view the current Fear & Greed Index
The crypto market sentiment remains cautious as the Fear and Greed Index stands at 34, indicating a state of fear. This suggests investors are wary and potentially looking for buying opportunities. During such periods, it's crucial to stay informed and consider dollar-cost averaging strategies. Remember, market sentiment can shift quickly, so always conduct thorough research and consider using tools like the Gate.com trading platform for real-time market analysis before making any investment decisions.
K21 Holdings Distribution
The address holdings distribution data reveals significant concentration in K21 token ownership. The top address holds 24.73% of the total supply, while the top 5 addresses collectively control 48.69% of all tokens. This high level of concentration raises concerns about potential market manipulation and price volatility.
Such a concentrated distribution could lead to increased market instability, as large holders have the ability to significantly impact price movements through their trading activities. The dominance of a few major addresses also suggests a relatively low level of decentralization in the K21 ecosystem, which may be a point of concern for investors seeking more distributed ownership structures.
However, it's worth noting that over half (51.31%) of the tokens are held by addresses outside the top 5, indicating some degree of distribution among smaller holders. This could provide a counterbalance to the influence of the largest stakeholders, potentially mitigating some of the risks associated with high concentration.
Click to view the current K21 Holdings Distribution
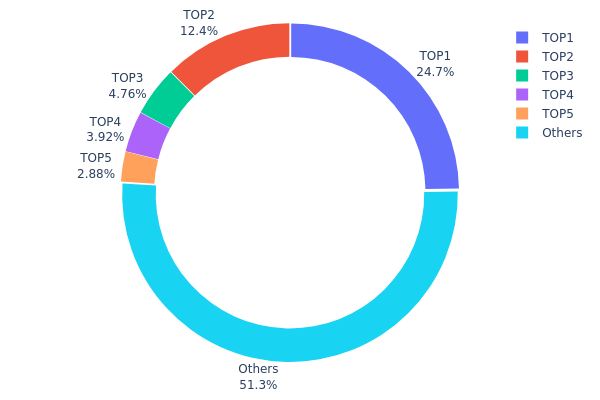
| Top | Address | Holding Qty | Holding (%) |
|---|---|---|---|
| 1 | 0x3bf8...5aa7f3 | 5194.72K | 24.73% |
| 2 | 0xa4fc...dec59a | 2608.36K | 12.42% |
| 3 | 0x3a5e...661af1 | 999.33K | 4.75% |
| 4 | 0x573f...507ef5 | 822.35K | 3.91% |
| 5 | 0x0d07...b492fe | 605.54K | 2.88% |
| - | Others | 10769.70K | 51.31% |
II. Key Factors Affecting K21's Future Price
Macroeconomic Environment
- Impact of Monetary Policy: Global economic fluctuations and trade policies are expected to influence K21's price. The ongoing recovery of economies worldwide may affect overall market sentiment.
- Inflation Hedging Properties: As an asset, K21 may be viewed as a potential hedge against inflation, especially in the context of current economic uncertainties.
- Geopolitical Factors: International trade tensions and global economic volatility could significantly impact K21's market performance.
Technical Development and Ecosystem Building
- Market Demand: The future price of K21 is likely to be heavily influenced by market demand, which is tied to its utility and adoption rates.
- Raw Material Price Fluctuations: As with many commodities, the price of raw materials used in K21's production or associated industries may affect its overall value and market price.
III. K21 Price Prediction for 2025-2030
2025 Outlook
- Conservative prediction: $0.02043 - $0.03783
- Neutral prediction: $0.03783 - $0.04388
- Optimistic prediction: $0.04388 - $0.04994 (requires positive market sentiment and increased adoption)
2027-2028 Outlook
- Market phase expectation: Potential growth phase with increased volatility
- Price range forecast:
- 2027: $0.03508 - $0.06487
- 2028: $0.03783 - $0.06154
- Key catalysts: Technological advancements, broader market trends, and potential partnerships
2029-2030 Long-term Outlook
- Base scenario: $0.059 - $0.06579 (assuming steady market growth and adoption)
- Optimistic scenario: $0.06579 - $0.07257 (with favorable market conditions and increased utility)
- Transformative scenario: Above $0.07257 (with groundbreaking developments and mainstream acceptance)
- 2030-12-31: K21 $0.06973 (potential peak before year-end consolidation)
| 年份 | 预测最高价 | 预测平均价格 | 预测最低价 | 涨跌幅 |
|---|---|---|---|---|
| 2025 | 0.04994 | 0.03783 | 0.02043 | 0 |
| 2026 | 0.05222 | 0.04388 | 0.03072 | 16 |
| 2027 | 0.06487 | 0.04805 | 0.03508 | 27 |
| 2028 | 0.06154 | 0.05646 | 0.03783 | 49 |
| 2029 | 0.07257 | 0.059 | 0.04779 | 55 |
| 2030 | 0.06973 | 0.06579 | 0.05197 | 73 |
IV. K21 Professional Investment Strategies and Risk Management
K21 Investment Methodology
(1) Long-term holding strategy
- Suitable for: Art enthusiasts and NFT collectors
- Operation suggestions:
- Accumulate K21 tokens during price dips
- Monitor Kanon's art acquisition activities
- Store tokens in a secure hardware wallet
(2) Active trading strategy
- Technical analysis tools:
- Moving Averages: Use to identify trends and potential reversals
- Relative Strength Index (RSI): Monitor overbought/oversold conditions
- Key points for swing trading:
- Set clear entry and exit points based on technical indicators
- Monitor trading volume for confirmation of price movements
K21 Risk Management Framework
(1) Asset allocation principles
- Conservative investors: 1-3% of crypto portfolio
- Aggressive investors: 5-10% of crypto portfolio
- Professional investors: Up to 15% of crypto portfolio
(2) Risk hedging solutions
- Diversification: Balance K21 with other crypto assets and traditional investments
- Stop-loss orders: Implement to limit potential losses
(3) Secure storage solutions
- Hardware wallet recommendation: Gate Web3 Wallet
- Cold storage solution: Store majority of long-term holdings offline
- Security precautions: Use two-factor authentication, avoid sharing private keys
V. Potential Risks and Challenges for K21
K21 Market Risks
- High volatility: Art market fluctuations may impact token value
- Limited liquidity: Potential difficulty in executing large trades
- Market sentiment: Shifts in NFT popularity could affect demand
K21 Regulatory Risks
- Unclear regulations: Potential changes in NFT and crypto regulations
- Cross-border compliance: Challenges in navigating international art laws
- Tax implications: Evolving tax treatment of NFT-related tokens
K21 Technical Risks
- Smart contract vulnerabilities: Potential for exploits or bugs
- Blockchain scalability: Ethereum network congestion may affect transactions
- Interoperability issues: Challenges in integrating with other platforms or chains
VI. Conclusion and Action Recommendations
K21 Investment Value Assessment
K21 offers unique exposure to the high-end art market through blockchain technology. While it presents an innovative investment opportunity, it carries significant risks due to market volatility and regulatory uncertainties.
K21 Investment Recommendations
✅ Beginners: Consider small, experimental positions to understand the market ✅ Experienced investors: Allocate a moderate portion within a diversified crypto portfolio ✅ Institutional investors: Explore K21 as part of a broader NFT and digital asset strategy
K21 Trading Participation Methods
- Spot trading: Purchase K21 tokens on Gate.com
- DeFi participation: Provide liquidity in K21 pools (if available)
- Long-term holding: Accumulate and store tokens securely for potential art market appreciation
Cryptocurrency investments are extremely risky. This article does not constitute investment advice. Investors should make decisions carefully based on their own risk tolerance and are advised to consult professional financial advisors. Never invest more than you can afford to lose.
FAQ
Does kava crypto have a future?
Kava crypto shows promise. Experts predict it could reach $0.5305. Its future depends on market trends and adoption, but long-term potential exists.
How high will crypto go in 2025?
Crypto markets are expected to reach new heights in 2025. Bitcoin could potentially hit $150,000, while Ethereum may surge to $15,000. Overall market cap might exceed $5 trillion.
What will the price of chainlink be in 2025?
Based on market trends and expert analysis, Chainlink's price could reach $15-$20 by 2025, driven by increased adoption and network growth.
How much will ankr be worth in 2030?
Based on current projections, Ankr (ANKR) could reach $0.012766 by 2030, assuming a 5% growth rate. This is a speculative estimate.
Share
Content
Introduction: K21's Market Position and Investment Value
I. K21 Price History Review and Current Market Status
II. Key Factors Affecting K21's Future Price
III. K21 Price Prediction for 2025-2030
IV. K21 Professional Investment Strategies and Risk Management
V. Potential Risks and Challenges for K21
VI. Conclusion and Action Recommendations
FAQ

