2025 MINT Price Prediction: Bullish Outlook as NFT Market Matures and Adoption Grows
Introduction: MINT's Market Position and Investment Value
Mint Blockchain (MINT), as an Ethereum native Layer2 network built on OP Stack technology, has achieved significant milestones since its inception. As of 2025, MINT's market capitalization has reached $567,863, with a circulating supply of approximately 195,950,279 tokens, and a price hovering around $0.002898. This asset, known as a "NFT-focused blockchain," is playing an increasingly crucial role in the fields of NFT minting, trading, and payment.
This article will comprehensively analyze MINT's price trends from 2025 to 2030, combining historical patterns, market supply and demand, ecosystem development, and macroeconomic factors to provide investors with professional price predictions and practical investment strategies.
I. MINT Price History Review and Current Market Status
MINT Historical Price Evolution Trajectory
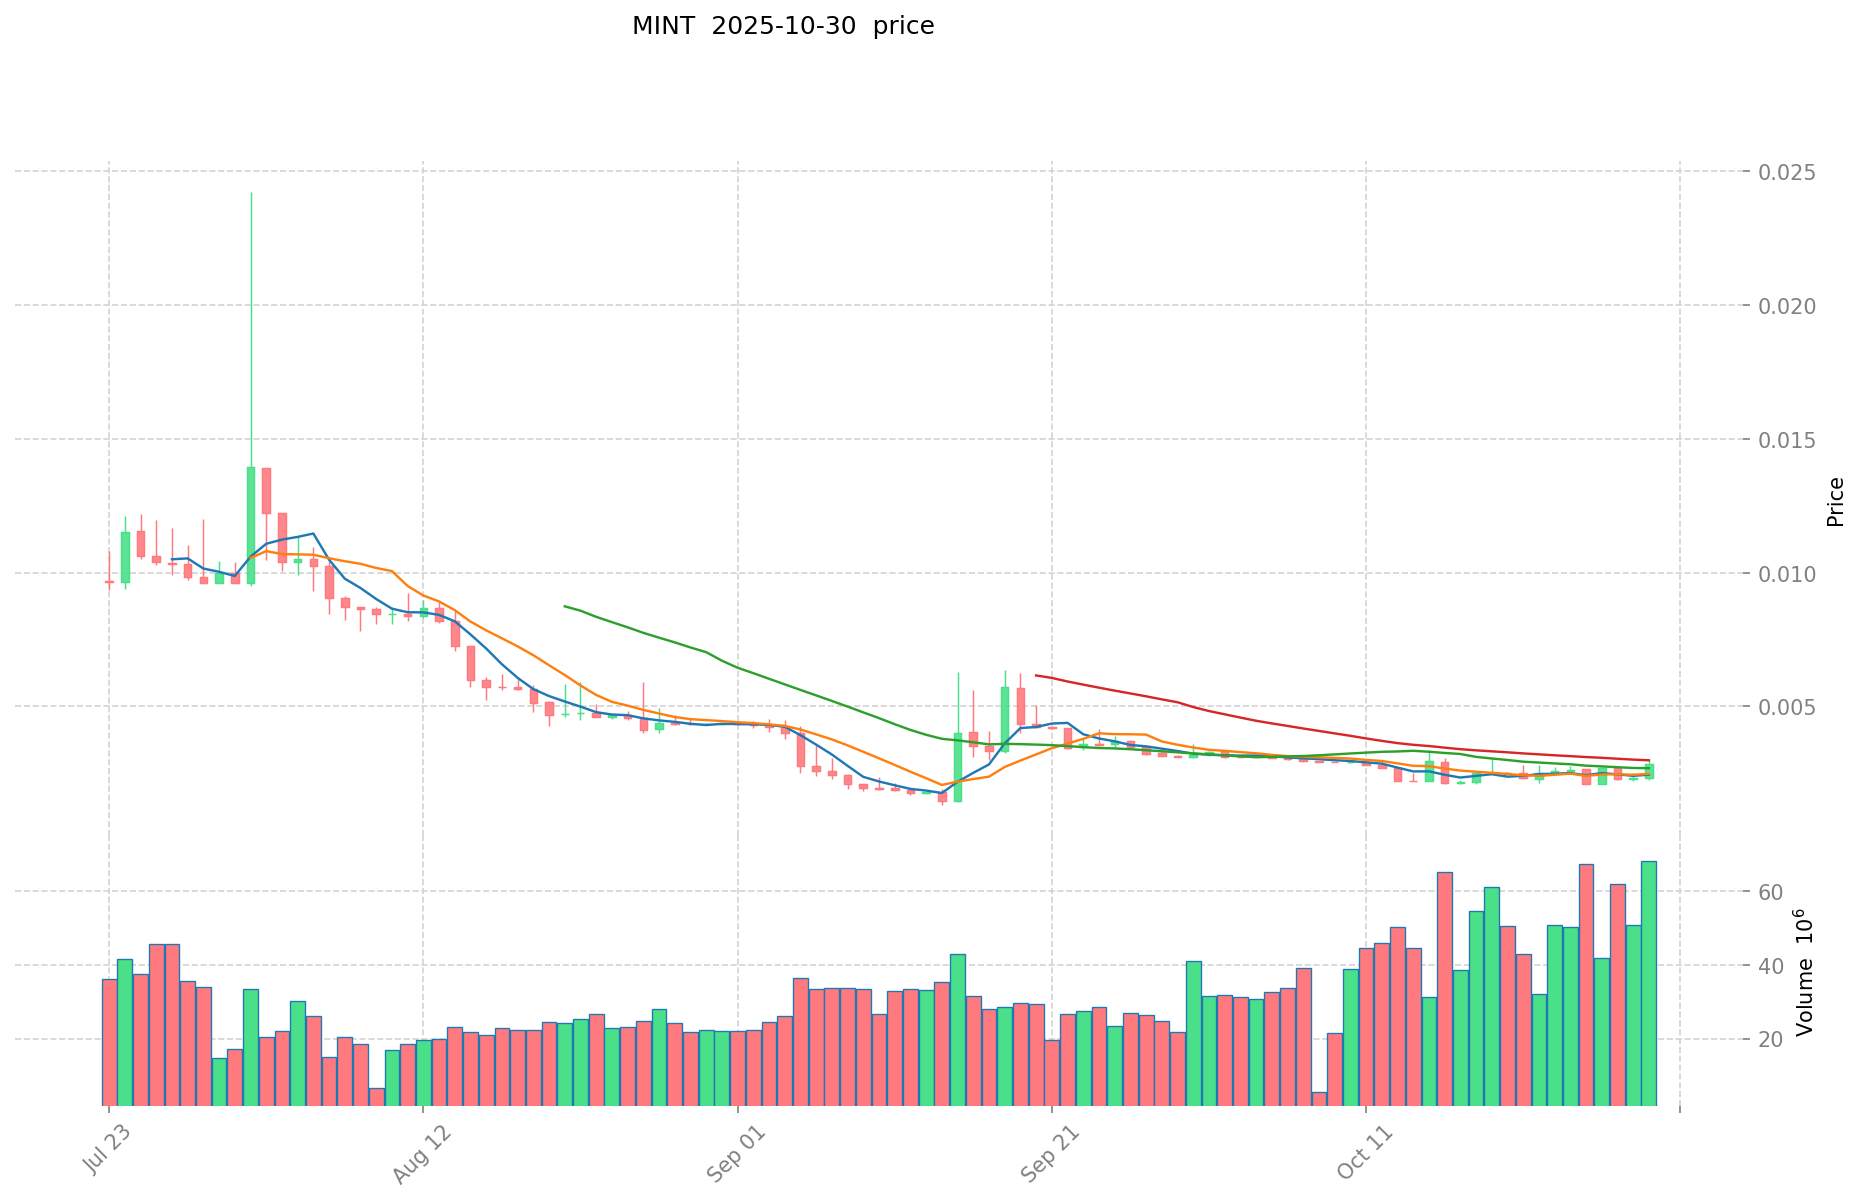
- 2025: MINT launched, price reached all-time high of $0.10503 on March 7
- 2025: Market correction, price dropped to all-time low of $0.001302 on September 14
- 2025: Price recovery and stabilization, currently trading at $0.002898
MINT Current Market Situation
As of October 30, 2025, MINT is trading at $0.002898, with a 24-hour trading volume of $230,267.49. The token has experienced a 5.48% increase in the last 24 hours. MINT's market cap stands at $567,863.91, ranking it at 3347th position in the cryptocurrency market. The circulating supply is 195,950,279.51 MINT tokens, which represents 19.6% of the total supply of 1 billion tokens. The fully diluted market cap is $2,898,000.
In terms of recent price trends, MINT has shown mixed performance across different timeframes. While it has gained 8.70% over the past week, it has declined by 8.45% in the last 30 days. More recently, the token has experienced a significant drop of 5.85% in the past hour, indicating high short-term volatility.
The current price of $0.002898 is significantly lower than its all-time high of $0.10503, representing a 97.24% decrease from its peak. However, it's also worth noting that the current price is 122.58% above its all-time low of $0.001302, suggesting some recovery from its lowest point.
Click to view the current MINT market price
MINT Market Sentiment Indicator
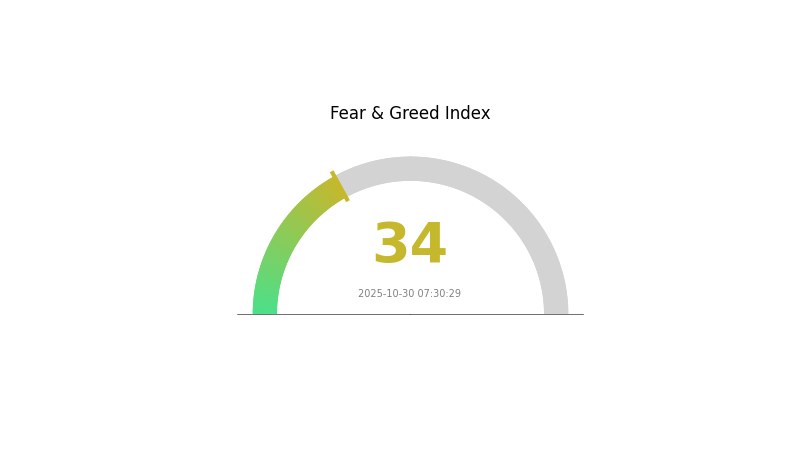
2025-10-30 Fear and Greed Index: 34 (Fear)
Click to view the current Fear & Greed Index
The crypto market sentiment is currently in a state of fear, with the Fear and Greed Index registering at 34. This indicates a cautious atmosphere among investors, potentially presenting buying opportunities for those with a higher risk tolerance. However, it's crucial to conduct thorough research and exercise prudence in investment decisions. Market conditions can change rapidly, and staying informed is key to navigating the volatile crypto landscape.
MINT Holdings Distribution
The address holdings distribution data for MINT reveals a unique pattern in its token allocation. This metric provides insights into the concentration of token ownership across different addresses, offering a glimpse into the project's decentralization and potential market dynamics.
Based on the provided data, MINT appears to have a relatively dispersed ownership structure, with no single address holding a significantly large portion of the total supply. This distribution suggests a healthier level of decentralization, which can contribute to reduced market manipulation risks and more organic price movements. The absence of large whale addresses typically indicates a more stable market structure, as it minimizes the impact of single-entity actions on token price and liquidity.
This balanced distribution may reflect positively on MINT's ecosystem, suggesting a diverse user base and potentially more resilient market dynamics. However, it's important to note that address distribution alone doesn't provide a complete picture of token ownership, as individual entities may control multiple addresses.
Click to view the current MINT holdings distribution

| Top | Address | Holding Qty | Holding (%) |
|---|
II. Key Factors Affecting MINT's Future Price
Supply Mechanism
- Fair Launch: The mechanism ensures that everyone can acquire assets equally, unlike mainstream Web3 projects where VCs can obtain tokens at lower costs and sell them at higher prices to the public.
Institutional and Whale Dynamics
- National Policies: Regulatory policies could potentially impact MINT's development and price.
Macroeconomic Environment
- Monetary Policy Impact: Market expectations for Federal Reserve interest rate cuts can influence MINT's price.
- Geopolitical Factors: Global trade uncertainties may affect MINT's value.
Technical Development and Ecosystem Building
- Ecosystem Applications: The development of DApps and ecosystem projects could play a role in MINT's future price.
III. MINT Price Prediction for 2025-2030
2025 Outlook
- Conservative prediction: $0.00167 - $0.00298
- Neutral prediction: $0.00298 - $0.00313
- Optimistic prediction: $0.00313 - $0.00328 (requires positive market sentiment)
2027-2028 Outlook
- Market phase expectation: Potential growth phase
- Price range forecast:
- 2027: $0.00291 - $0.00439
- 2028: $0.00274 - $0.00481
- Key catalysts: Increased adoption, technological advancements
2030 Long-term Outlook
- Base scenario: $0.00468 - $0.00501 (assuming steady market growth)
- Optimistic scenario: $0.00501 - $0.00637 (assuming strong market performance)
- Transformative scenario: $0.00637+ (extremely favorable market conditions)
- 2030-12-31: MINT $0.00637 (potential peak)
| 年份 | 预测最高价 | 预测平均价格 | 预测最低价 | 涨跌幅 |
|---|---|---|---|---|
| 2025 | 0.00328 | 0.00298 | 0.00167 | 2 |
| 2026 | 0.00373 | 0.00313 | 0.00163 | 8 |
| 2027 | 0.00439 | 0.00343 | 0.00291 | 18 |
| 2028 | 0.00481 | 0.00391 | 0.00274 | 34 |
| 2029 | 0.00501 | 0.00436 | 0.00353 | 50 |
| 2030 | 0.00637 | 0.00468 | 0.00253 | 61 |
IV. MINT Professional Investment Strategy and Risk Management
MINT Investment Methodology
(1) Long-term Holding Strategy
- Suitable for: Long-term value investors
- Operation suggestions:
- Accumulate MINT tokens during market dips
- Set price targets and adjust holdings accordingly
- Store tokens in Gate Web3 wallet for enhanced security
(2) Active Trading Strategy
- Technical analysis tools:
- Moving Averages: Use to identify trend directions
- RSI (Relative Strength Index): Gauge overbought/oversold conditions
- Key points for swing trading:
- Monitor volume changes for potential trend reversals
- Set stop-loss orders to manage downside risk
MINT Risk Management Framework
(1) Asset Allocation Principles
- Conservative investors: 1-3% of crypto portfolio
- Aggressive investors: 5-10% of crypto portfolio
- Professional investors: 10-15% of crypto portfolio
(2) Risk Hedging Solutions
- Diversification: Spread investments across multiple Layer 2 projects
- Staking: Participate in MINT staking programs to earn passive income
(3) Secure Storage Solutions
- Hot wallet recommendation: Gate Web3 wallet
- Cold storage solution: Hardware wallet for large holdings
- Security precautions: Enable two-factor authentication, use strong passwords
V. MINT Potential Risks and Challenges
MINT Market Risks
- High volatility: Price fluctuations can be extreme
- Limited liquidity: May affect ability to exit positions quickly
- Competition: Other Layer 2 solutions may impact MINT's market share
MINT Regulatory Risks
- Uncertain regulatory environment: Potential for new regulations affecting Layer 2 networks
- Cross-border compliance: Varying regulations across jurisdictions
- Tax implications: Evolving tax laws for crypto assets
MINT Technical Risks
- Smart contract vulnerabilities: Potential for exploits or bugs
- Scalability challenges: May face issues as network usage grows
- Interoperability concerns: Integration with other blockchain networks
VI. Conclusion and Action Recommendations
MINT Investment Value Assessment
MINT presents a promising opportunity in the Layer 2 ecosystem, with potential for long-term growth. However, investors should be aware of short-term volatility and technical risks associated with emerging blockchain technologies.
MINT Investment Recommendations
✅ Beginners: Start with small positions, focus on learning the technology ✅ Experienced investors: Consider a balanced approach with regular portfolio rebalancing ✅ Institutional investors: Conduct thorough due diligence and consider OTC options for large positions
MINT Trading Participation Methods
- Spot trading: Available on Gate.com for direct token purchases
- Staking: Participate in MINT staking programs for passive income
- DeFi integration: Explore MINT-based DeFi protocols for additional utility
Cryptocurrency investments carry extremely high risks, and this article does not constitute investment advice. Investors should make decisions carefully based on their own risk tolerance and are advised to consult professional financial advisors. Never invest more than you can afford to lose.
FAQ
Will Mana reach $20?
Based on analyst predictions, MANA is expected to reach $20 by the end of 2025, driven by increased adoption and growth in the metaverse sector.
Can mana coin reach $100?
While ambitious, reaching $100 is unlikely for MANA in the near future. Current forecasts suggest a more modest target of around $0.42 by 2025, based on market trends and technical indicators.
What will Mana be worth in 2025?
Based on predictions, MANA could be worth around $0.24 on average in 2025, with a minimum value of about $0.24 per token.
What will Decentraland be worth in 2030?
Based on statistical models, Decentraland's MANA token is projected to reach an average price of $0.14 by mid-2030 and $0.11 by the end of the year.
Share
Content
Introduction: MINT's Market Position and Investment Value
I. MINT Price History Review and Current Market Status
II. Key Factors Affecting MINT's Future Price
III. MINT Price Prediction for 2025-2030
IV. MINT Professional Investment Strategy and Risk Management
V. MINT Potential Risks and Challenges
VI. Conclusion and Action Recommendations
FAQ

