BRIC vs BTC: The Battle for Global Economic Dominance in the Digital Age
Introduction: BRIC vs BTC Investment Comparison
In the cryptocurrency market, the comparison between Redbrick (BRIC) vs Bitcoin (BTC) remains an unavoidable topic for investors. The two not only differ significantly in market cap ranking, application scenarios, and price performance but also represent different positions in the crypto asset landscape.
Redbrick (BRIC): Since its launch, it has gained market recognition for its AI-powered Web3 content platform enabling users to create, publish, and monetize games and applications.
Bitcoin (BTC): Since its inception in 2008, it has been hailed as "digital gold" and is one of the cryptocurrencies with the highest global trading volume and market capitalization.
This article will provide a comprehensive analysis of the investment value comparison between BRIC vs BTC, focusing on historical price trends, supply mechanisms, institutional adoption, technological ecosystems, and future predictions, attempting to answer the question investors care about most:
"Which is the better buy right now?" I. Price History Comparison and Current Market Status
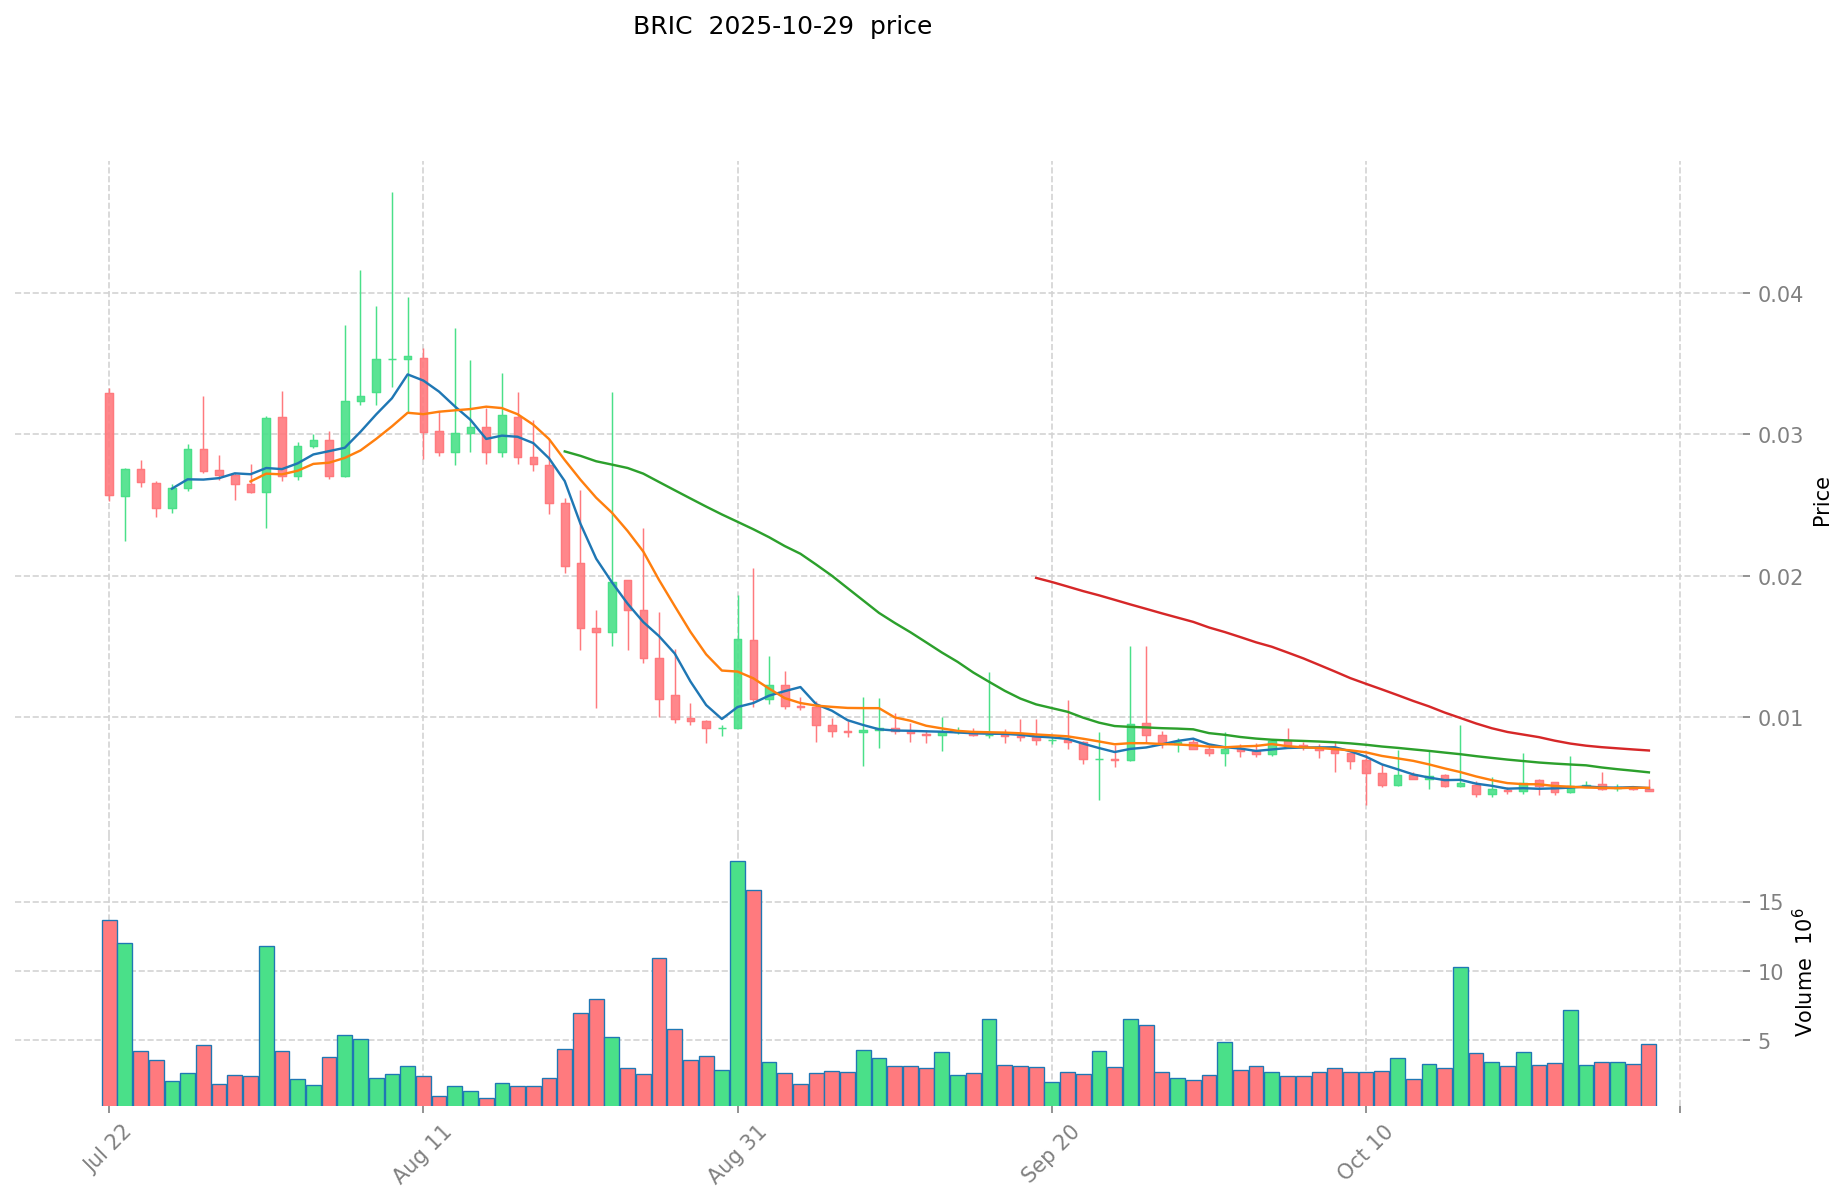
BRIC (Redbrick) and BTC (Bitcoin) Historical Price Trends
- 2025: BRIC reached its all-time high of $0.092295 on July 18, 2025.
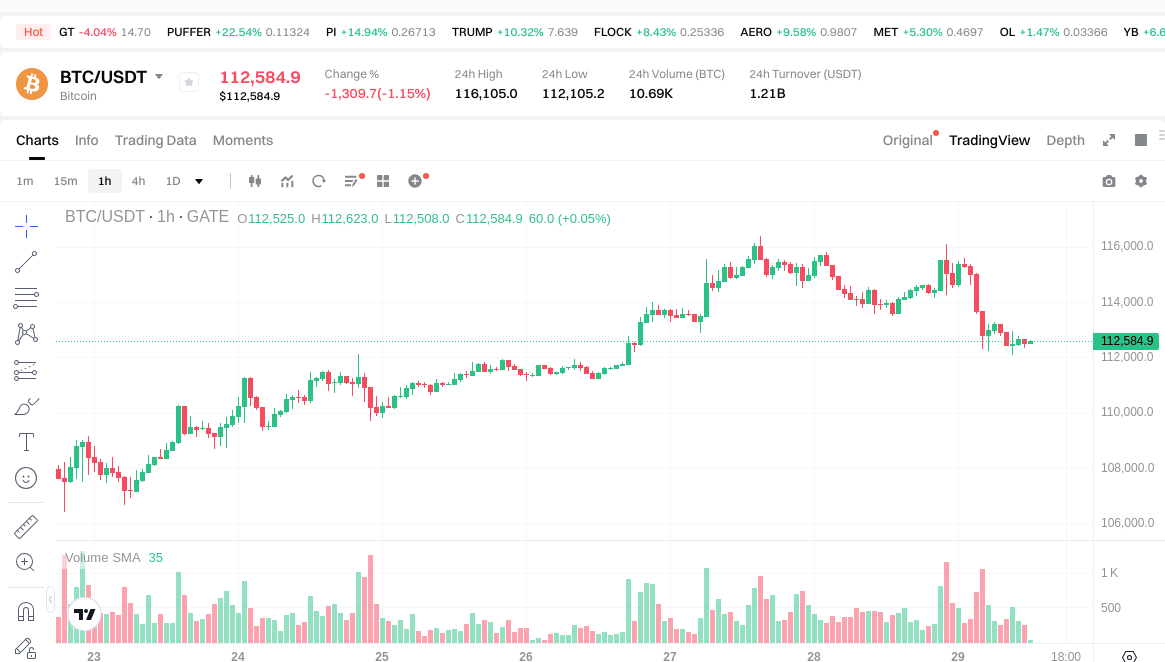
- 2025: BTC hit a record high of $126,080 on October 7, 2025.
- Comparative analysis: In the recent market cycle, BRIC dropped from its peak of $0.092295 to a low of $0.003761, while BTC has shown more stability, currently trading around $112,562.
Current Market Situation (2025-10-29)
- BRIC current price: $0.004879
- BTC current price: $112,562
- 24-hour trading volume: $25,444.68 (BRIC) vs $1,222,901,497.86 (BTC)
- Market Sentiment Index (Fear & Greed Index): 51 (Neutral)
Click to view real-time prices:
- Check BRIC current price Market Price
- Check BTC current price Market Price
Comparative Analysis of BRIC vs BTC Investment Value Factors
Supply Mechanism Comparison (Tokenomics)
- BRIC: Associated with blockchain technology and cross-chain support mechanisms
- BTC: Fixed supply with halvening mechanism creating scarcity
- 📌 Historical Pattern: BTC's supply limitations have historically driven price cycles, while BRIC's value appears more tied to technological utility and adoption.
Institutional Adoption and Market Applications
- Institutional Holdings: BTC has gained recognition as a "de-politicized" reserve asset amid global de-dollarization trends
- Enterprise Adoption: BRIC leverages Web2 and Web3 technology integration, connecting traditional and on-chain ecosystems for creators and projects
- National Policies: BRICS nations are exploring de-dollarized payment systems, while the US approach to BTC has evolved toward strategic reserve considerations
Technical Development and Ecosystem Construction
- BRIC Technical Foundation: Built on blockchain technology with cross-chain support and account abstraction capabilities
- BTC Technical Position: Maintains value through established blockchain technology while serving as potential hedge in global financial system shifts
- Ecosystem Comparison: BRIC aims to create a creative economy platform connecting creators, gamers, and project teams across traditional and blockchain environments
Macroeconomic Factors and Market Cycles
- Inflation Response: BTC increasingly viewed as potential hedge against dollar devaluation and inflation concerns
- Monetary Policy Impact: US debt financing costs and credit risks affecting market perceptions of both assets
- Geopolitical Factors: BRICS alliance countries' de-dollarization initiatives potentially strengthening alternative asset cases, while Trump administration has signaled additional tariffs on BRICS alliance countries
III. 2025-2030 Price Prediction: BRIC vs BTC
Short-term Prediction (2025)
- BRIC: Conservative $0.00370728 - $0.004878 | Optimistic $0.004878 - $0.00565848
- BTC: Conservative $91,191.42 - $112,582 | Optimistic $112,582 - $156,488.98
Mid-term Prediction (2027)
- BRIC may enter a growth phase, with expected prices ranging from $0.00592677 to $0.0077640687
- BTC may enter a bullish market, with expected prices ranging from $82,550.976664 to $200,027.366532
- Key drivers: Institutional capital inflow, ETF, ecosystem development
Long-term Prediction (2030)
- BRIC: Base scenario $0.00878541119379 - $0.010103222872858 | Optimistic scenario $0.010103222872858+
- BTC: Base scenario $194,933.7331440139 - $206,629.757132654734 | Optimistic scenario $206,629.757132654734+
Disclaimer: The above predictions are based on historical data and market analysis. Cryptocurrency markets are highly volatile and subject to change. This information should not be considered as financial advice. Always conduct your own research before making investment decisions.
BRIC:
| 年份 | 预测最高价 | 预测平均价格 | 预测最低价 | 涨跌幅 |
|---|---|---|---|---|
| 2025 | 0.00565848 | 0.004878 | 0.00370728 | 0 |
| 2026 | 0.0065853 | 0.00526824 | 0.003160944 | 7 |
| 2027 | 0.0077640687 | 0.00592677 | 0.0034967943 | 21 |
| 2028 | 0.0073245987045 | 0.00684541935 | 0.0056816980605 | 40 |
| 2029 | 0.01048581336033 | 0.00708500902725 | 0.005313756770437 | 45 |
| 2030 | 0.010103222872858 | 0.00878541119379 | 0.005710517275963 | 80 |
BTC:
| 年份 | 预测最高价 | 预测平均价格 | 预测最低价 | 涨跌幅 |
|---|---|---|---|---|
| 2025 | 156488.98 | 112582 | 91191.42 | 0 |
| 2026 | 182968.2664 | 134535.49 | 108973.7469 | 19 |
| 2027 | 200027.366532 | 158751.8782 | 82550.976664 | 41 |
| 2028 | 199122.48082626 | 179389.622366 | 107633.7734196 | 59 |
| 2029 | 200611.4146918978 | 189256.05159613 | 157082.5228247879 | 68 |
| 2030 | 206629.757132654734 | 194933.7331440139 | 181288.371823932927 | 73 |
IV. Investment Strategy Comparison: BRIC vs BTC
Long-term vs Short-term Investment Strategies
- BRIC: Suitable for investors focused on Web3 content platforms and ecosystem potential
- BTC: Suitable for investors seeking stability and inflation hedge properties
Risk Management and Asset Allocation
- Conservative investors: BRIC: 10% vs BTC: 90%
- Aggressive investors: BRIC: 30% vs BTC: 70%
- Hedging tools: Stablecoin allocation, options, cross-currency portfolios
V. Potential Risk Comparison
Market Risk
- BRIC: Higher volatility, less liquidity, and market sentiment susceptibility
- BTC: Macroeconomic factors, institutional sentiment shifts
Technical Risk
- BRIC: Scalability, network stability
- BTC: Mining centralization, security vulnerabilities
Regulatory Risk
- Global regulatory policies may impact both differently, with BTC potentially facing more scrutiny due to its larger market presence
VI. Conclusion: Which Is the Better Buy?
📌 Investment Value Summary:
- BRIC advantages: Web3 content platform potential, cross-chain support
- BTC advantages: Established market position, institutional adoption, potential inflation hedge
✅ Investment Advice:
- New investors: Consider a smaller allocation to BRIC, larger allocation to BTC for stability
- Experienced investors: Balanced portfolio with both, adjusting based on risk tolerance
- Institutional investors: BTC for reserve asset potential, BRIC for exposure to Web3 innovation
⚠️ Risk Warning: Cryptocurrency markets are highly volatile. This article does not constitute investment advice. None
VII. FAQ
Q1: What are the key differences between BRIC and BTC? A: BRIC is associated with AI-powered Web3 content platforms, while BTC is known as "digital gold" with a fixed supply. BRIC focuses on enabling users to create and monetize content, while BTC serves as a potential hedge against inflation and currency devaluation.
Q2: Which cryptocurrency has shown more price stability recently? A: Bitcoin (BTC) has shown more stability in the recent market cycle. While BRIC dropped from its peak of $0.092295 to a low of $0.003761, BTC is currently trading around $112,562, closer to its all-time high of $126,080.
Q3: How do the supply mechanisms of BRIC and BTC differ? A: BRIC's supply is associated with blockchain technology and cross-chain support mechanisms. BTC has a fixed supply with a halvening mechanism that creates scarcity over time.
Q4: What are the institutional adoption trends for BRIC and BTC? A: BTC has gained recognition as a "de-politicized" reserve asset among institutions. BRIC leverages Web2 and Web3 technology integration, connecting traditional and on-chain ecosystems for creators and projects.
Q5: What are the predicted price ranges for BRIC and BTC in 2030? A: For BRIC, the base scenario predicts a range of $0.00878541119379 - $0.010103222872858. For BTC, the base scenario predicts a range of $194,933.7331440139 - $206,629.757132654734.
Q6: How should investors allocate their portfolios between BRIC and BTC? A: Conservative investors might consider allocating 10% to BRIC and 90% to BTC, while aggressive investors might allocate 30% to BRIC and 70% to BTC. The specific allocation should be based on individual risk tolerance and investment goals.
Q7: What are the main risks associated with investing in BRIC and BTC? A: BRIC faces higher volatility, less liquidity, and market sentiment susceptibility. BTC is subject to macroeconomic factors and institutional sentiment shifts. Both face regulatory risks, with BTC potentially facing more scrutiny due to its larger market presence.
Share
Content

