CWAR vs DOT: Comparing Two Blockchain Solutions for Scalability and Interoperability
Introduction: CWAR vs DOT Investment Comparison
In the cryptocurrency market, the comparison between CWAR vs DOT has always been an unavoidable topic for investors. The two not only have significant differences in market cap ranking, application scenarios, and price performance, but also represent different cryptocurrency asset positioning.
Cryowar Token (CWAR): Since its launch in 2021, it has gained market recognition for its real-time multiplayer PVP gaming experience on the Solana network.
Polkadot (DOT): Since its inception in 2020, it has been hailed as the "Internet of Blockchains," and is one of the cryptocurrencies with high global trading volume and market capitalization.
This article will comprehensively analyze the investment value comparison between CWAR vs DOT, focusing on historical price trends, supply mechanisms, institutional adoption, technological ecosystems, and future predictions, attempting to answer the question investors care most about:
"Which is the better buy right now?" I. Price History Comparison and Current Market Status
CWAR and DOT Historical Price Trends
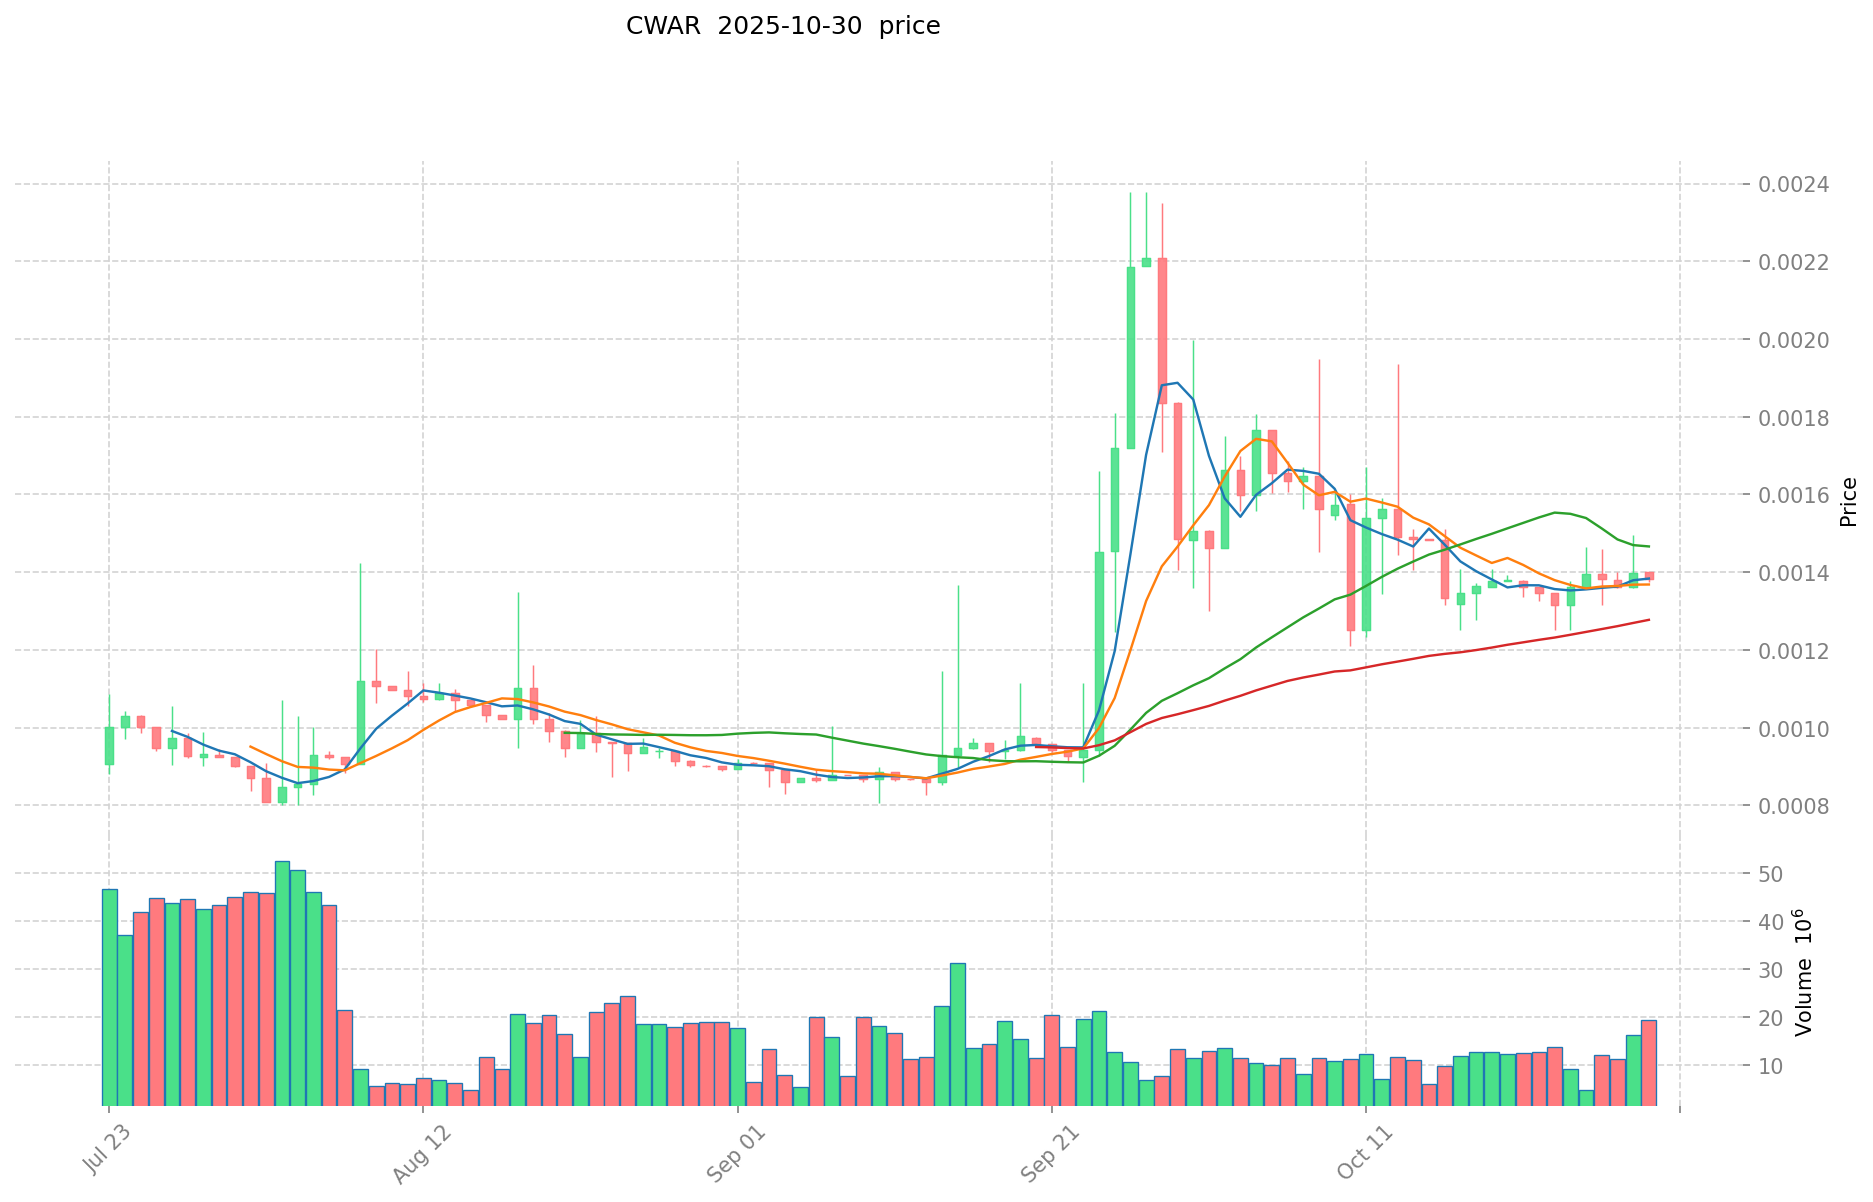
- 2021: CWAR reached its all-time high of $6.29 during its initial launch period.
- 2021: DOT hit its all-time high of $54.98 amid the overall crypto market bull run.
- Comparative analysis: During the recent bear market, CWAR dropped from its peak of $6.29 to a low of $0.00066523, while DOT declined from $54.98 to a low of $2.13.
Current Market Situation (2025-10-31)
- CWAR current price: $0.0013723
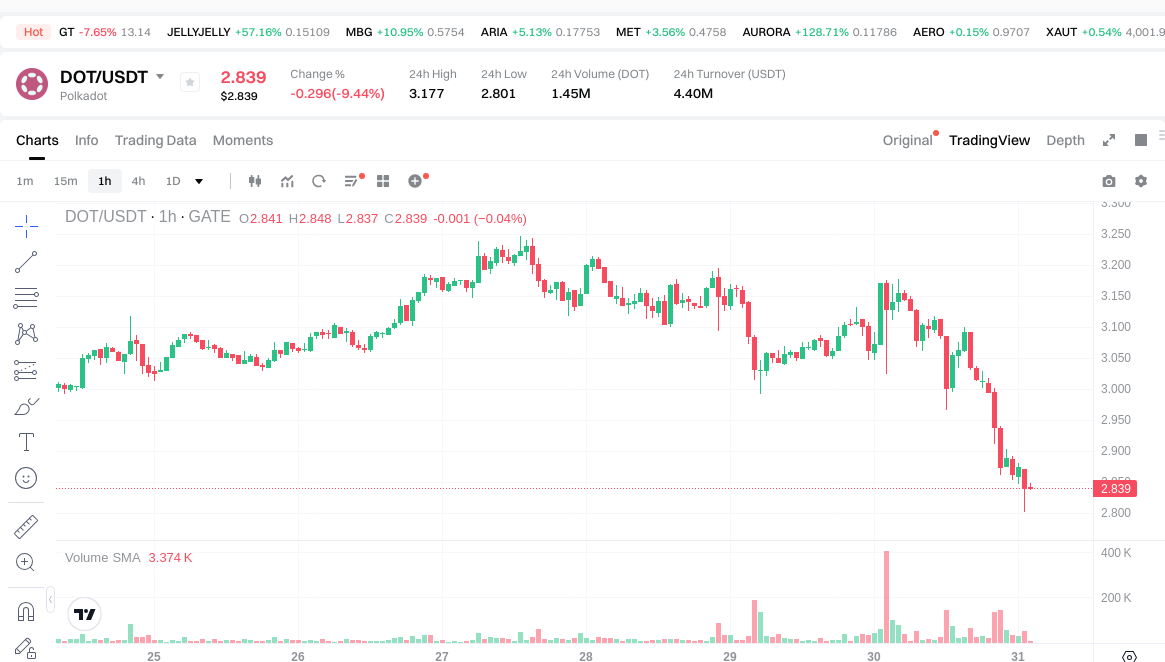
- DOT current price: $2.837
- 24-hour trading volume: $17,994.61 (CWAR) vs $4,576,739.99 (DOT)
- Market Sentiment Index (Fear & Greed Index): 34 (Fear)
Click to view real-time prices:
- View CWAR current price Market Price
- View DOT current price Market Price
Key Factors Affecting CWAR vs DOT Investment Value
Supply Mechanisms (Tokenomics)
- CWAR: Limited information available on supply mechanism
- DOT: Limited information available on supply mechanism
- 📌 Historical pattern: Insufficient data on how supply mechanisms drive price cycle changes
Institutional Adoption and Market Applications
- Institutional holdings: Limited information on institutional preferences
- Enterprise adoption: Limited data on applications in cross-border payments, settlements, and portfolio investments
- National policies: Regulatory attitudes vary by country, with geopolitical uncertainty continuing to increase
Technical Development and Ecosystem Building
- Technical upgrades: Insufficient information on current technical developments
- Ecosystem comparison: Limited data on DeFi, NFT, payment, and smart contract implementations
Macroeconomic Factors and Market Cycles
- Performance in inflationary environments: Limited information on anti-inflation properties
- Macroeconomic monetary policies: Investment portfolio capital flows and technical factors appear to have greater influence on USD trends
- Geopolitical factors: The Russia-Ukraine conflict has significantly increased commodity prices, and Federal Reserve rate hikes have led to global liquidity tightening, affecting fragile economies in terms of demand, production chains, supply chains, and capital chains
III. 2025-2030 Price Prediction: CWAR vs DOT
Short-term Prediction (2025)
- CWAR: Conservative $0.001121678 - $0.0013679 | Optimistic $0.0013679 - $0.001586764
- DOT: Conservative $2.29878 - $2.838 | Optimistic $2.838 - $4.22862
Mid-term Prediction (2027)
- CWAR may enter a growth phase, with estimated prices ranging from $0.001277153514 to $0.0020616906726
- DOT may enter a bullish market, with estimated prices ranging from $3.354877845 to $4.3613411985
- Key drivers: Institutional capital inflow, ETF developments, ecosystem growth
Long-term Prediction (2030)
- CWAR: Base scenario $0.002737339090975 - $0.003750154554635 | Optimistic scenario $0.003750154554635+
- DOT: Base scenario $5.558951512950412 - $5.725720058338924 | Optimistic scenario $5.725720058338924+
Disclaimer: This analysis is based on historical data and projections. Cryptocurrency markets are highly volatile and unpredictable. This information should not be considered as financial advice. Always conduct your own research before making investment decisions.
CWAR:
| 年份 | 预测最高价 | 预测平均价格 | 预测最低价 | 涨跌幅 |
|---|---|---|---|---|
| 2025 | 0.001586764 | 0.0013679 | 0.001121678 | 0 |
| 2026 | 0.00217167804 | 0.001477332 | 0.00107845236 | 7 |
| 2027 | 0.0020616906726 | 0.00182450502 | 0.001277153514 | 32 |
| 2028 | 0.002817491877135 | 0.0019430978463 | 0.001884804910911 | 41 |
| 2029 | 0.003094383320232 | 0.002380294861717 | 0.001380571019796 | 73 |
| 2030 | 0.003750154554635 | 0.002737339090975 | 0.001724523627314 | 99 |
DOT:
| 年份 | 预测最高价 | 预测平均价格 | 预测最低价 | 涨跌幅 |
|---|---|---|---|---|
| 2025 | 4.22862 | 2.838 | 2.29878 | 0 |
| 2026 | 3.9219741 | 3.53331 | 2.6853156 | 24 |
| 2027 | 4.3613411985 | 3.72764205 | 3.354877845 | 31 |
| 2028 | 5.2982840277675 | 4.04449162425 | 3.316483131885 | 42 |
| 2029 | 6.446515199892075 | 4.67138782600875 | 3.783824139067087 | 64 |
| 2030 | 5.725720058338924 | 5.558951512950412 | 4.002445089324297 | 95 |
IV. Investment Strategy Comparison: CWAR vs DOT
Long-term vs Short-term Investment Strategies
- CWAR: Suitable for investors interested in gaming ecosystems and Solana-based projects
- DOT: Suitable for investors looking for interoperability solutions and ecosystem potential
Risk Management and Asset Allocation
- Conservative investors: CWAR: 10% vs DOT: 90%
- Aggressive investors: CWAR: 30% vs DOT: 70%
- Hedging tools: Stablecoin allocation, options, cross-currency portfolios
V. Potential Risk Comparison
Market Risk
- CWAR: Higher volatility due to smaller market cap and gaming sector fluctuations
- DOT: Susceptible to overall crypto market trends and competitor advancements
Technical Risk
- CWAR: Scalability, network stability on Solana
- DOT: Parachain adoption, cross-chain security
Regulatory Risk
- Global regulatory policies may impact both, with potentially greater scrutiny on gaming tokens like CWAR
VI. Conclusion: Which Is the Better Buy?
📌 Investment Value Summary:
- CWAR advantages: Niche gaming market, potential for rapid growth
- DOT advantages: Established ecosystem, interoperability focus, larger market cap
✅ Investment Advice:
- New investors: Consider a small allocation to DOT for broader crypto exposure
- Experienced investors: Balanced portfolio with both CWAR and DOT, adjust based on risk tolerance
- Institutional investors: Focus on DOT for its established market position and ecosystem potential
⚠️ Risk Warning: Cryptocurrency markets are highly volatile. This analysis does not constitute investment advice. None
VII. FAQ
Q1: What are the main differences between CWAR and DOT? A: CWAR is a gaming token on the Solana network, while DOT is the native token of Polkadot, focusing on blockchain interoperability. DOT has a larger market cap and trading volume, while CWAR is more niche and potentially volatile.
Q2: Which token has shown better price performance historically? A: DOT has shown better overall price performance. Its all-time high was $54.98 in 2021, compared to CWAR's all-time high of $6.29. However, both have experienced significant drops during the bear market.
Q3: What are the key factors affecting the investment value of CWAR and DOT? A: Key factors include supply mechanisms, institutional adoption, technical development, ecosystem building, and macroeconomic factors such as inflation and geopolitical events.
Q4: What are the price predictions for CWAR and DOT in 2030? A: For CWAR, the base scenario predicts a range of $0.002737339090975 to $0.003750154554635. For DOT, the base scenario predicts a range of $5.558951512950412 to $5.725720058338924. Optimistic scenarios suggest higher potential prices for both tokens.
Q5: How should investors allocate their portfolio between CWAR and DOT? A: Conservative investors might consider allocating 10% to CWAR and 90% to DOT, while aggressive investors might opt for 30% CWAR and 70% DOT. The exact allocation should be based on individual risk tolerance and investment goals.
Q6: What are the main risks associated with investing in CWAR and DOT? A: Both tokens face market risks, technical risks, and regulatory risks. CWAR may have higher volatility due to its smaller market cap and focus on the gaming sector. DOT faces risks related to parachain adoption and cross-chain security.
Q7: Which token is better for new investors? A: For new investors, DOT might be a more suitable option due to its larger market cap, established ecosystem, and focus on interoperability. However, investors should always conduct their own research and consider their risk tolerance before making investment decisions.
Share
Content

