MINT vs UNI: Which Token Offers Better Long-Term Investment Potential in the DeFi Ecosystem?
Introduction: MINT vs UNI Investment Comparison
In the cryptocurrency market, the comparison between MINT and UNI has always been a topic that investors can't ignore. The two not only show significant differences in market cap ranking, application scenarios, and price performance but also represent different positioning in the crypto asset space.
Mint Blockchain (MINT): Launched in 2025, it has gained market recognition for its focus on NFT asset issuance, trading, and settlement as an Ethereum Layer 2 network.
Uniswap (UNI): Since its inception in 2020, it has been hailed as the pioneer of automated market-making protocols on the Ethereum blockchain, becoming one of the most traded and highest market cap cryptocurrencies globally.
This article will comprehensively analyze the investment value comparison between MINT and UNI, focusing on historical price trends, supply mechanisms, institutional adoption, technological ecosystems, and future predictions, attempting to answer the question investors are most concerned about:
"Which is the better buy right now?"
I. Price History Comparison and Current Market Status
MINT and UNI Historical Price Trends
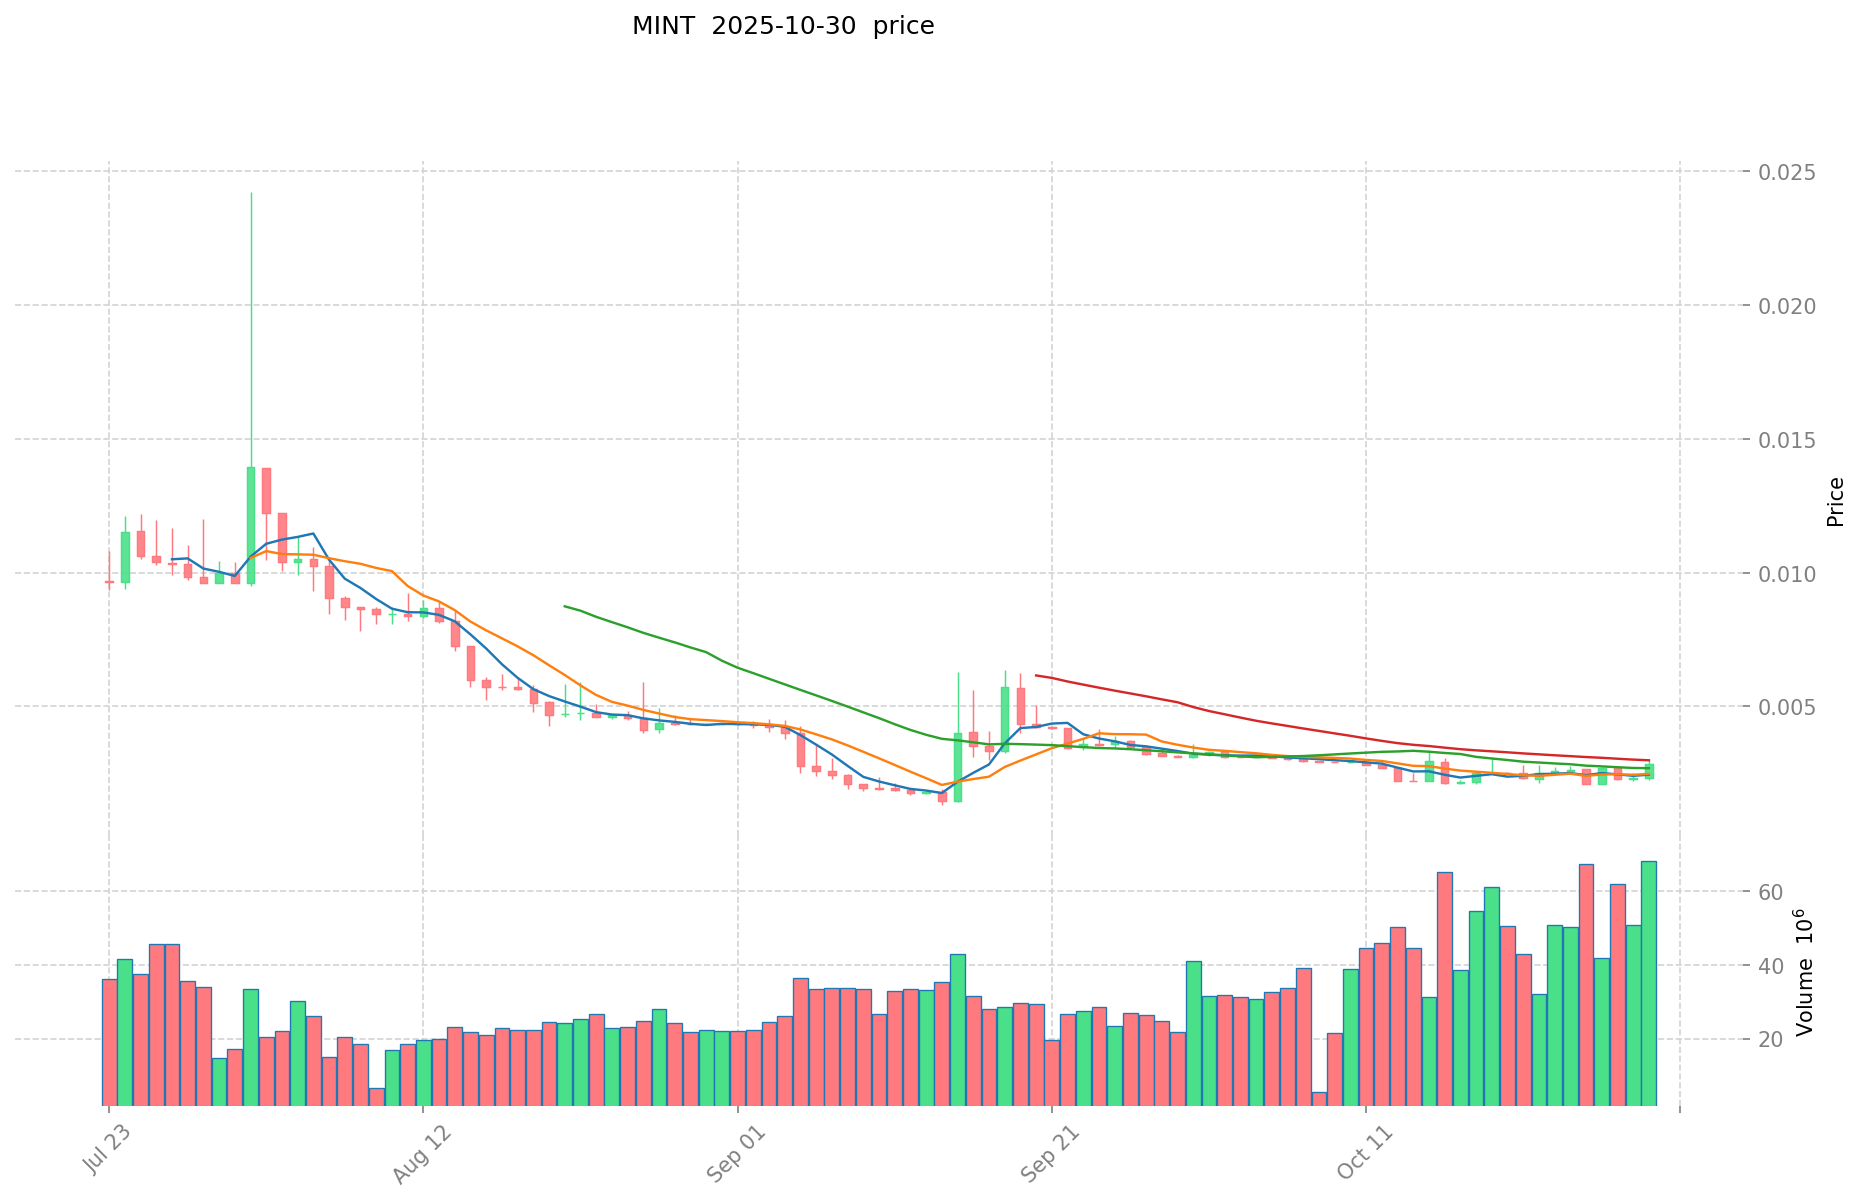
- 2025: MINT reached an all-time high of $0.10503 on March 7, likely due to increased adoption.
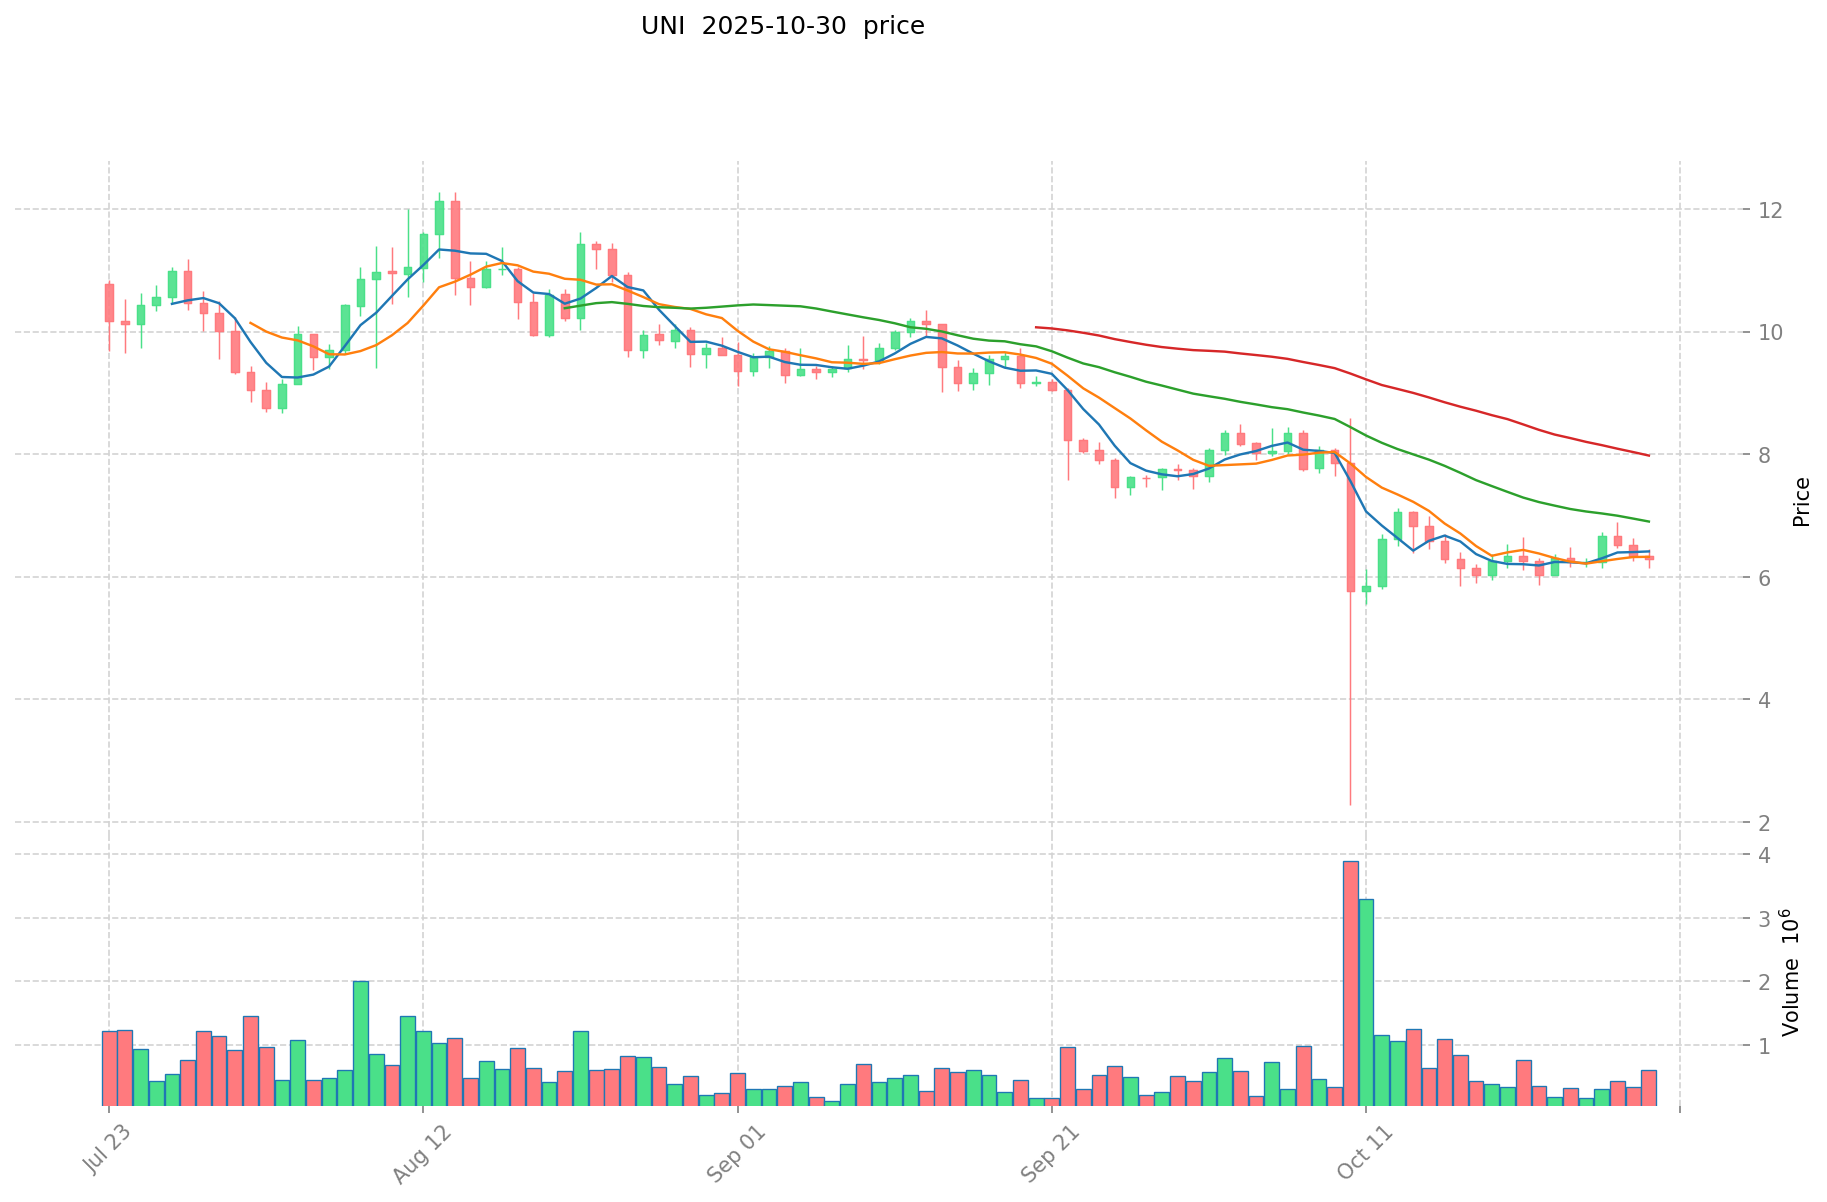
- 2021: UNI hit its all-time high of $44.92 on May 3, influenced by the broader DeFi boom.
- Comparative analysis: In the recent market cycle, MINT dropped from its high of $0.10503 to a low of $0.001302, while UNI declined from $44.92 to current levels around $6.
Current Market Situation (2025-10-30)
- MINT current price: $0.003055
- UNI current price: $6.026
- 24-hour trading volume: $230,048 (MINT) vs $6,469,135 (UNI)
- Market sentiment index (Fear & Greed Index): 34 (Fear)
Click to view real-time prices:
- Check MINT current price Market Price
- Check UNI current price Market Price
Investment Value Analysis: MINT vs UNI
I. Core Factors Influencing MINT vs UNI Investment Value
Technological Infrastructure and Value Proposition
- Mint Ventures: Focuses on reducing transaction costs through blockchain technology, a fundamental value driver in their investment approach
- Uniswap: Utilizes automated market maker (AMM) formula with constant product equation (x · y = k) for efficient trading across asset pairs
- 📌 Key Insight: Both leverage blockchain to create value, but with different technical approaches to liquidity provision and trading efficiency
Market Position and Business Models
- Curve Finance vs Uniswap: Direct competitors with different specialized areas:
- Curve excels in stablecoin trading and DeFi receipt markets
- Uniswap dominates in broader cryptocurrency trading pairs
- Market Evolution: Curve's V2 aims to create 5-10x higher liquidity than Uniswap's model, particularly for non-pegged assets
Liquidity and Trading Mechanisms
- Curve: Employs specialized liquidity pools with EMA (exponentially moving average) oracle for price stability
- Uniswap: Broader market coverage with concentrated liquidity features in V3
- Trading Volume Comparison: Both platforms show significant transaction volumes with different asset specializations
Governance and Community Engagement
- Curve's Governance: Utilizes "Gauge Weight Voting" through veCRV to determine incentive allocations
- Development Teams: Led by technical founders with strong academic backgrounds
- Community Support: Both platforms rely on active community participation for protocol governance
II. Future Growth and Strategic Development
Market Expansion Strategies
- Curve: Plans to enter forex trading markets using stablecoins
- DeFi Receipt Market: Curve serves as the largest marketplace for DeFi receipts (cTokens, aTokens, yTokens)
- Innovation Pace: Both platforms continuously evolve their technical approaches to trading and liquidity provision
III. Price Predictions for 2025-2030: MINT vs UNI
Short-term Predictions (2025)
- MINT: Conservative $0.00285231 - $0.003067 | Optimistic $0.003067 - $0.0036804
- UNI: Conservative $4.68468 - $6.006 | Optimistic $6.006 - $8.76876
Mid-term Predictions (2027)
- MINT may enter a growth phase, with prices expected in the range of $0.00199588092 - $0.00583110308
- UNI may enter a bullish market, with prices expected in the range of $5.978237265 - $10.025044029
- Key drivers: Institutional capital inflow, ETF developments, ecosystem growth
Long-term Predictions (2030)
- MINT: Base scenario $0.005925322845832 - $0.006517855130415 | Optimistic scenario $0.006517855130415+
- UNI: Base scenario $12.25712008205685 - $17.405110516520727 | Optimistic scenario $17.405110516520727+
Disclaimer: This analysis is based on historical data and market projections. Cryptocurrency markets are highly volatile and subject to change. This information should not be considered as financial advice. Always conduct your own research before making investment decisions.
MINT:
| 年份 | 预测最高价 | 预测平均价格 | 预测最低价 | 涨跌幅 |
|---|---|---|---|---|
| 2025 | 0.0036804 | 0.003067 | 0.00285231 | 0 |
| 2026 | 0.004453284 | 0.0033737 | 0.003103804 | 10 |
| 2027 | 0.00583110308 | 0.003913492 | 0.00199588092 | 28 |
| 2028 | 0.0052133583678 | 0.00487229754 | 0.0032644393518 | 59 |
| 2029 | 0.006807817737765 | 0.0050428279539 | 0.004740258276666 | 65 |
| 2030 | 0.006517855130415 | 0.005925322845832 | 0.004858764733582 | 93 |
UNI:
| 年份 | 预测最高价 | 预测平均价格 | 预测最低价 | 涨跌幅 |
|---|---|---|---|---|
| 2025 | 8.76876 | 6.006 | 4.68468 | 0 |
| 2026 | 11.0071962 | 7.38738 | 5.6882826 | 22 |
| 2027 | 10.025044029 | 9.1972881 | 5.978237265 | 52 |
| 2028 | 12.87896252643 | 9.6111660645 | 5.57447631741 | 59 |
| 2029 | 13.2691758686487 | 11.245064295465 | 5.8474334336418 | 86 |
| 2030 | 17.405110516520727 | 12.25712008205685 | 11.153979274671733 | 103 |
IV. Investment Strategy Comparison: MINT vs UNI
Long-term vs Short-term Investment Strategies
- MINT: Suitable for investors focused on NFT ecosystems and Layer 2 scalability solutions
- UNI: Suitable for investors interested in DeFi growth and decentralized exchange adoption
Risk Management and Asset Allocation
- Conservative investors: MINT: 20% vs UNI: 80%
- Aggressive investors: MINT: 40% vs UNI: 60%
- Hedging tools: Stablecoin allocation, options, cross-currency portfolios
V. Potential Risk Comparison
Market Risks
- MINT: Higher volatility due to lower market cap and trading volume
- UNI: Exposure to broader DeFi market fluctuations
Technical Risks
- MINT: Scalability, network stability
- UNI: Smart contract vulnerabilities, liquidity pool imbalances
Regulatory Risks
- Global regulatory policies may impact both differently, with UNI potentially facing more scrutiny due to its larger market presence
VI. Conclusion: Which Is the Better Buy?
📌 Investment Value Summary:
- MINT advantages: Focus on NFT market, potential for rapid growth as Layer 2 solution
- UNI advantages: Established market position, larger ecosystem, proven track record in DeFi
✅ Investment Advice:
- Novice investors: Consider a smaller allocation to MINT for exposure to NFT growth, larger allocation to UNI for established DeFi presence
- Experienced investors: Balanced portfolio with both MINT and UNI, adjusting based on risk tolerance and market trends
- Institutional investors: UNI for significant DeFi exposure, MINT for targeted NFT market participation
⚠️ Risk Warning: Cryptocurrency markets are highly volatile. This article does not constitute investment advice. None
VII. FAQ
Q1: What are the key differences between MINT and UNI? A: MINT focuses on NFT asset issuance and trading as an Ethereum Layer 2 network, while UNI is a pioneer in automated market-making protocols on Ethereum. MINT has a lower market cap and trading volume, while UNI has a more established presence in the DeFi space.
Q2: Which cryptocurrency has shown better price performance historically? A: UNI has shown better historical price performance, reaching an all-time high of $44.92 in May 2021. MINT's all-time high was $0.10503 in March 2025. However, both have experienced significant drops from their peaks.
Q3: How do the current market situations of MINT and UNI compare? A: As of October 30, 2025, MINT's price is $0.003055 with a 24-hour trading volume of $230,048, while UNI's price is $6.026 with a 24-hour trading volume of $6,469,135. UNI has significantly higher liquidity and market activity.
Q4: What are the long-term price predictions for MINT and UNI? A: By 2030, MINT's base scenario price range is predicted to be $0.005925322845832 - $0.006517855130415, while UNI's base scenario range is $12.25712008205685 - $17.405110516520727. Both show potential for growth, with UNI projected to have higher absolute values.
Q5: How should investors allocate their portfolio between MINT and UNI? A: Conservative investors might consider allocating 20% to MINT and 80% to UNI, while aggressive investors might opt for 40% MINT and 60% UNI. The exact allocation should be based on individual risk tolerance and market trends.
Q6: What are the main risks associated with investing in MINT and UNI? A: MINT faces higher volatility due to its lower market cap and trading volume, as well as potential scalability and network stability issues. UNI is exposed to broader DeFi market fluctuations and potential smart contract vulnerabilities. Both face regulatory risks, with UNI possibly facing more scrutiny due to its larger market presence.
Q7: Which cryptocurrency might be better for novice investors? A: For novice investors, UNI might be a safer choice due to its established market position and larger ecosystem. However, a small allocation to MINT could provide exposure to potential growth in the NFT market and Layer 2 solutions.
Share
Content
Introduction: MINT vs UNI Investment Comparison
I. Price History Comparison and Current Market Status
I. Core Factors Influencing MINT vs UNI Investment Value
II. Future Growth and Strategic Development
III. Price Predictions for 2025-2030: MINT vs UNI
IV. Investment Strategy Comparison: MINT vs UNI
V. Potential Risk Comparison
VI. Conclusion: Which Is the Better Buy?
VII. FAQ

