WAM vs ZIL: A Comparative Analysis of Two Emerging Blockchain Platforms
Introduction: Investment Comparison between WAM and ZIL
In the cryptocurrency market, the comparison between WAM vs ZIL has always been an unavoidable topic for investors. The two not only show significant differences in market cap ranking, application scenarios, and price performance, but also represent different positioning in the crypto asset space.
WAM (WAM): Launched in 2021, it has gained market recognition for its play-to-earn gaming platform.
Zilliqa (ZIL): Since its introduction in 2018, it has been hailed as a high-throughput public blockchain platform, and is one of the cryptocurrencies with significant transaction volume and market capitalization globally.
This article will comprehensively analyze the investment value comparison between WAM vs ZIL, focusing on historical price trends, supply mechanisms, institutional adoption, technological ecosystems, and future predictions, attempting to answer the question investors care about most:
"Which is the better buy right now?"
I. Price History Comparison and Current Market Status
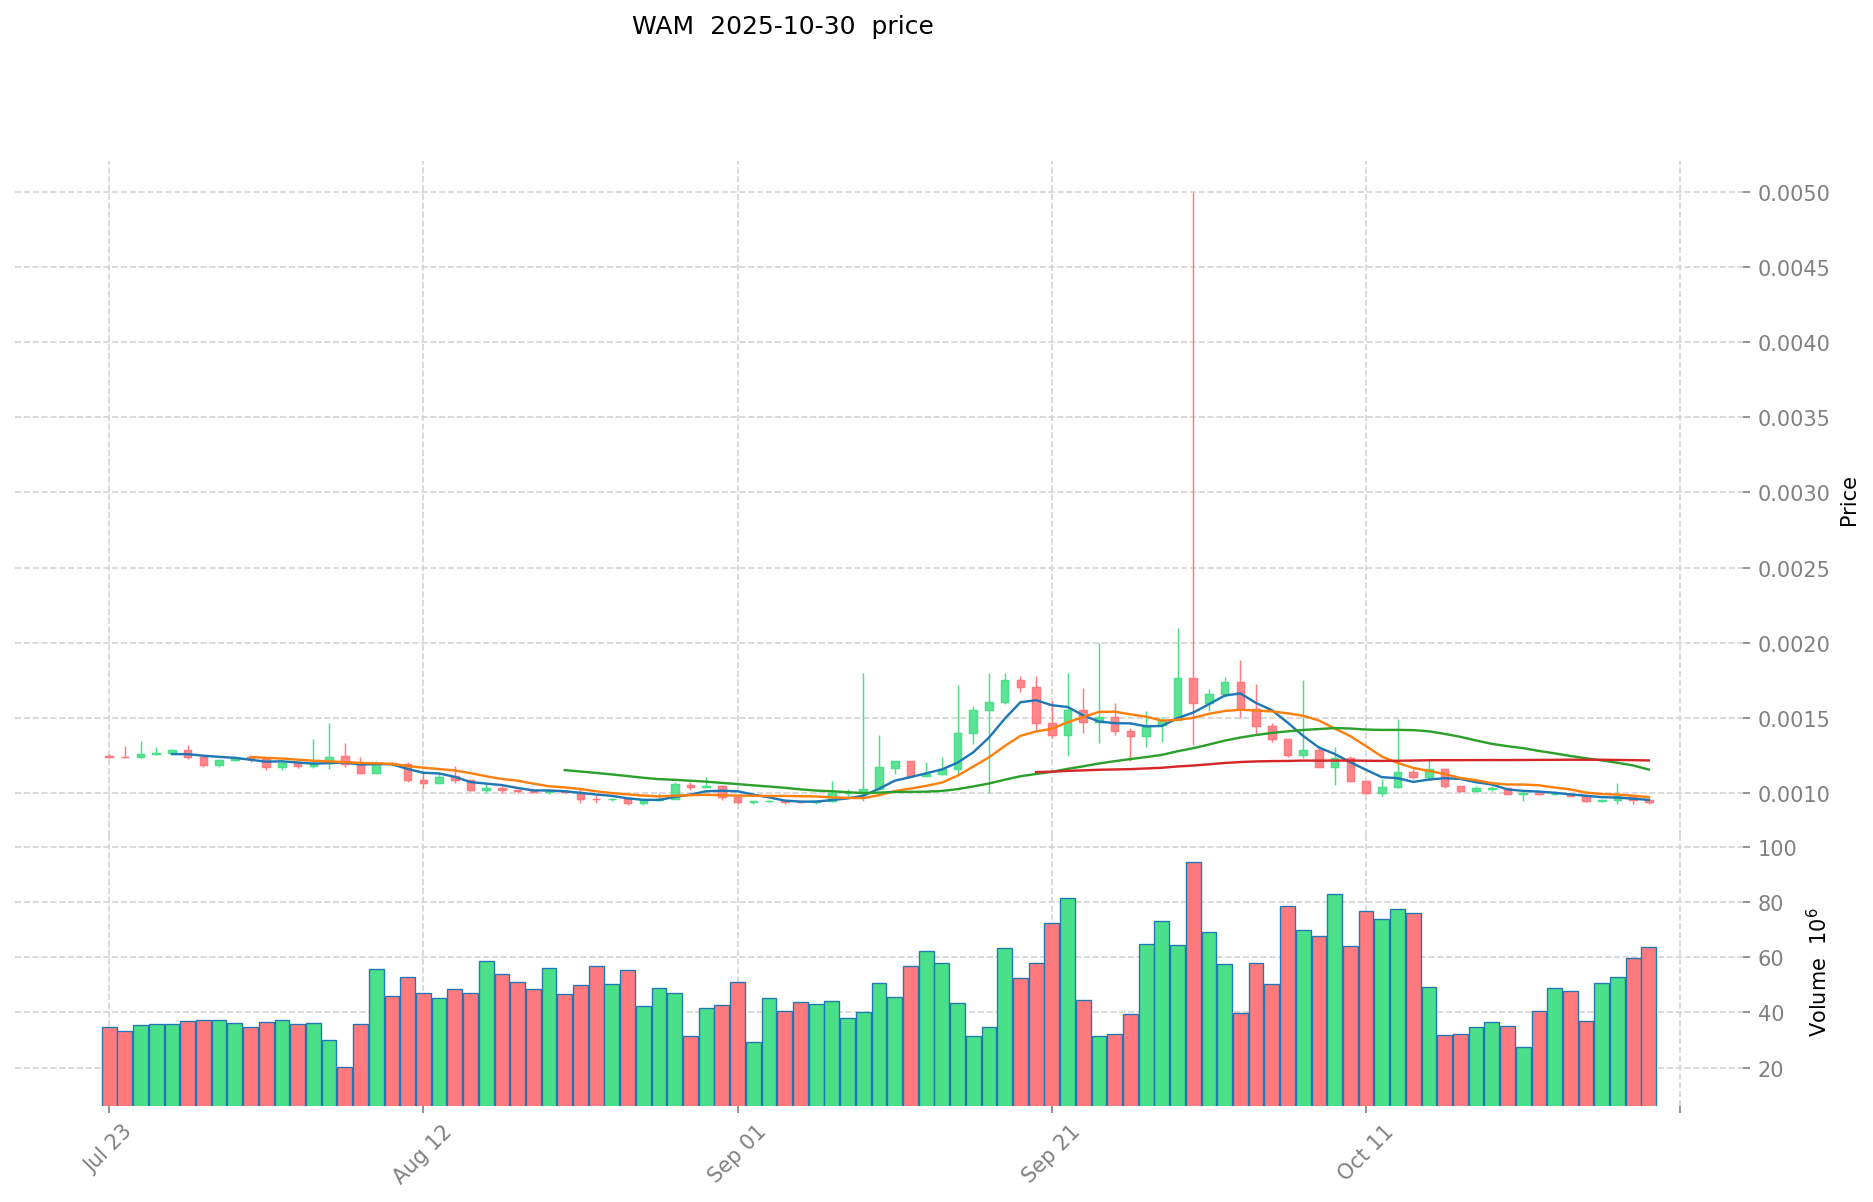
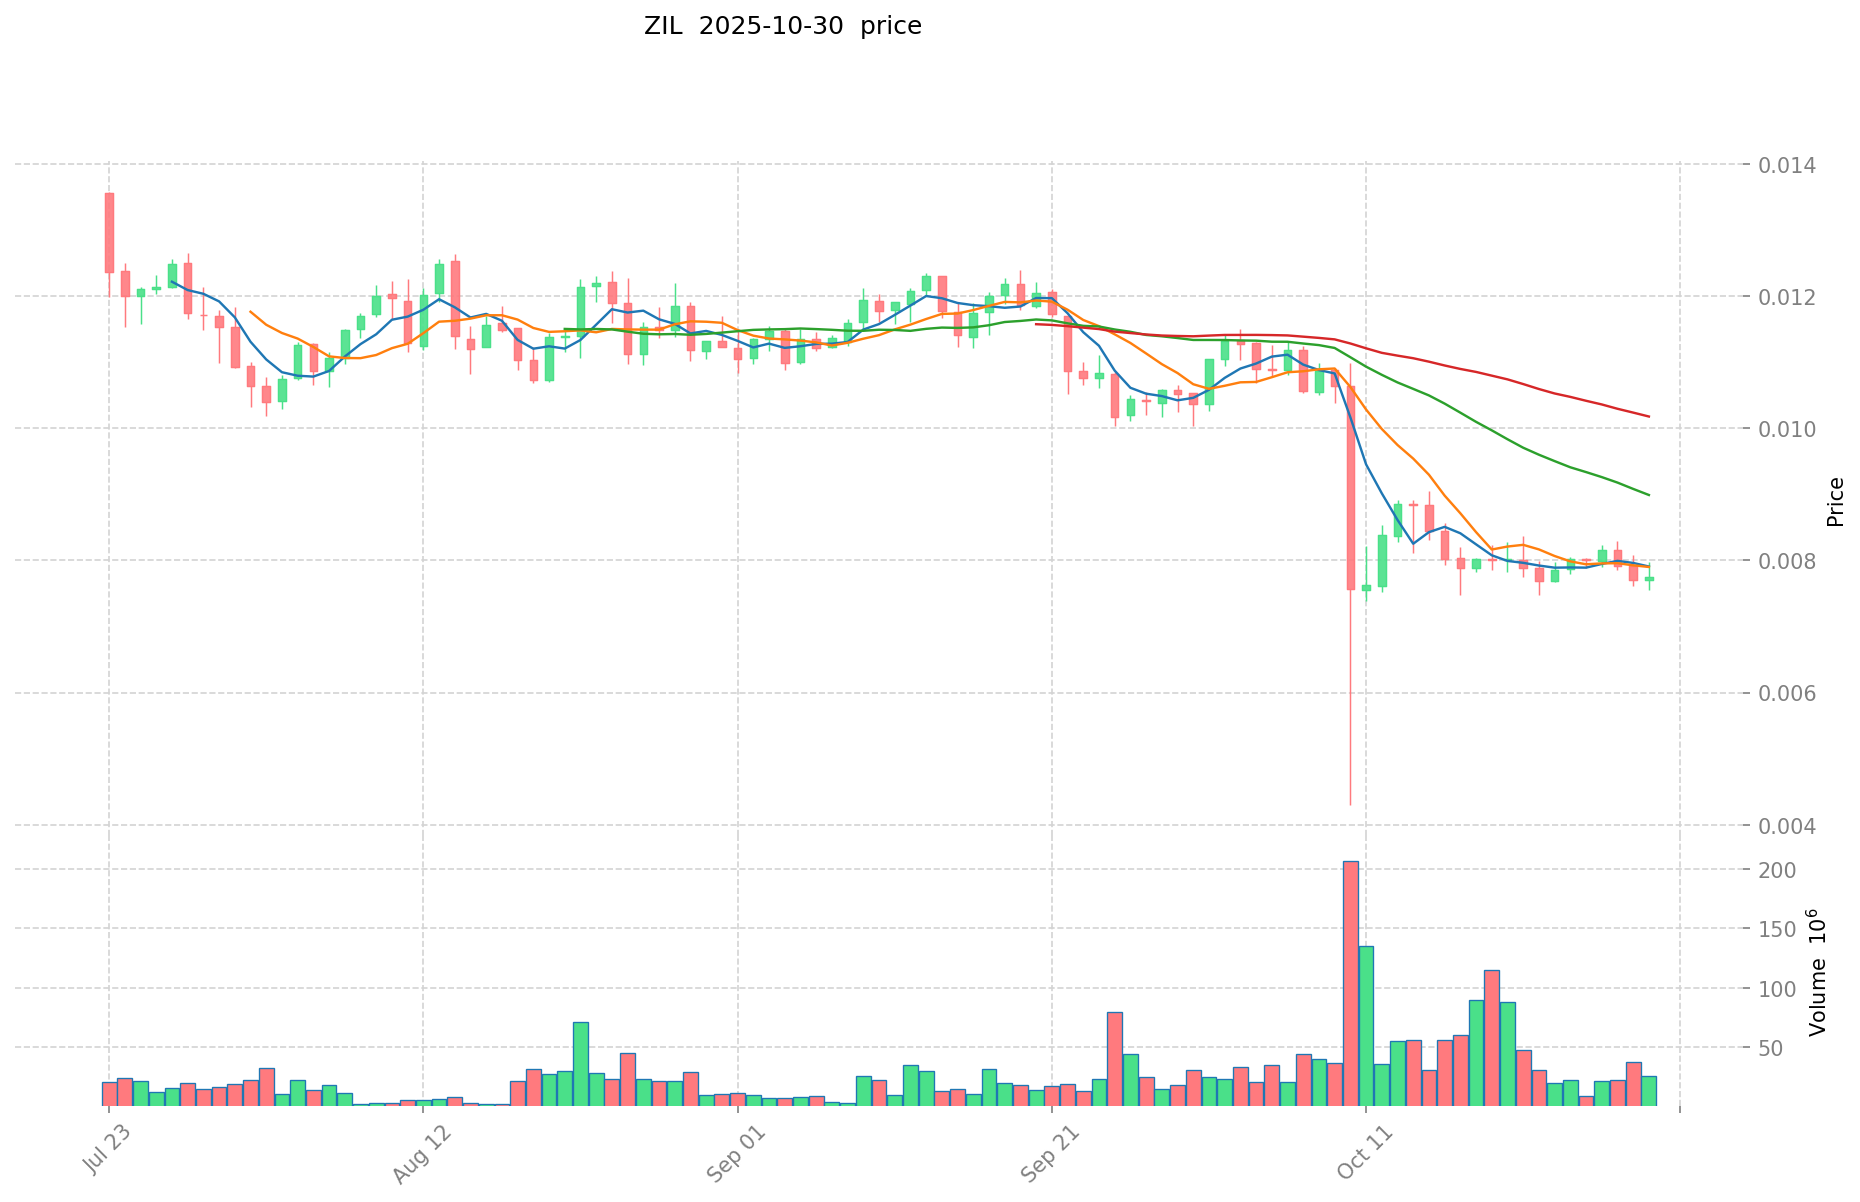
WAM and ZIL Historical Price Trends
- 2021: WAM reached its all-time high of $0.194038 on December 19, 2021.
- 2021: ZIL hit its all-time high of $0.255376 on May 7, 2021.
- Comparative analysis: During the market cycle, WAM dropped from its peak of $0.194038 to a low of $0.00077968, while ZIL declined from $0.255376 to $0.00239616.
Current Market Situation (2025-10-30)
- WAM current price: $0.000945
- ZIL current price: $0.007805
- 24-hour trading volume: WAM $60,131.93 vs ZIL $199,501.79
- Market Sentiment Index (Fear & Greed Index): 34 (Fear)
Click to view real-time prices:
- Check WAM current price Market Price
- Check ZIL current price Market Price
Investment Value Core Factors: WAM vs ZIL
Valuation Methodology Comparison
- Relative Valuation: Applies models like PE, PEG, and PS ratios to compare assets within the same industry or against market benchmarks.
- Absolute Valuation: Uses models like FCFF to determine intrinsic value based on cash flow projections and discount rates.
- 📌 Historical Pattern: Each methodology performs differently across market cycles, with relative valuation dominating during growth phases.
Institutional Adoption and Market Applications
- Institutional Holdings: Growth potential and increasing market capitalization attract institutional investors looking for emerging opportunities.
- Enterprise Adoption: Applications in cross-border payments, settlements, and portfolio diversification strategies remain key differentiators.
- Regulatory Attitudes: Regulatory clarity and compliance frameworks significantly impact institutional confidence and adoption rates.
Technical Development and Ecosystem Building
- Technology Advances: AI integration, blockchain scalability solutions, and energy efficiency improvements drive long-term value.
- Ecosystem Growth: Development of DeFi applications, NFT platforms, and smart contract implementations enhance utility and demand.
- Network Effects: User base growth and developer activity correlation with long-term value creation and market positioning.
Macroeconomic Factors and Market Cycles
- Inflation Environment: Assets with limited supply mechanisms often show better inflation resistance properties during economic uncertainty.
- Monetary Policy Impact: Global interest rates and US dollar strength significantly influence capital flows and valuation metrics.
- Geopolitical Factors: Cross-border transaction demand and international tensions create both challenges and opportunities in the crypto asset space.
III. 2025-2030 Price Prediction: WAM vs ZIL
Short-term Prediction (2025)
- WAM: Conservative $0.0006608 - $0.000944 | Optimistic $0.000944 - $0.00102896
- ZIL: Conservative $0.00555007 - $0.007817 | Optimistic $0.007817 - $0.00961491
Mid-term Prediction (2027)
- WAM may enter a growth phase, with estimated prices ranging from $0.000961226112 to $0.001071366604
- ZIL may enter a bullish market, with estimated prices ranging from $0.007070382696 to $0.011240095568
- Key drivers: Institutional capital inflow, ETF, ecosystem development
Long-term Prediction (2030)
- WAM: Base scenario $0.001343073184992 - $0.00166541074939 | Optimistic scenario $0.00166541074939
- ZIL: Base scenario $0.014256175792622 - $0.016252040403589 | Optimistic scenario $0.016252040403589
Disclaimer: The above predictions are based on historical data and market analysis. Cryptocurrency markets are highly volatile and subject to change. This information should not be considered as financial advice. Always conduct your own research before making investment decisions.
WAM:
| 年份 | 预测最高价 | 预测平均价格 | 预测最低价 | 涨跌幅 |
|---|---|---|---|---|
| 2025 | 0.00102896 | 0.000944 | 0.0006608 | 0 |
| 2026 | 0.0010160744 | 0.00098648 | 0.0006017528 | 4 |
| 2027 | 0.001071366604 | 0.0010012772 | 0.000961226112 | 5 |
| 2028 | 0.00120213340632 | 0.001036321902 | 0.00063215636022 | 9 |
| 2029 | 0.001566918715824 | 0.00111922765416 | 0.000660344315954 | 18 |
| 2030 | 0.00166541074939 | 0.001343073184992 | 0.000926720497644 | 42 |
ZIL:
| 年份 | 预测最高价 | 预测平均价格 | 预测最低价 | 涨跌幅 |
|---|---|---|---|---|
| 2025 | 0.00961491 | 0.007817 | 0.00555007 | 0 |
| 2026 | 0.0094132314 | 0.008715955 | 0.00583968985 | 11 |
| 2027 | 0.011240095568 | 0.0090645932 | 0.007070382696 | 16 |
| 2028 | 0.01390871180608 | 0.010152344384 | 0.007614258288 | 30 |
| 2029 | 0.016481823490204 | 0.01203052809504 | 0.009865033037932 | 54 |
| 2030 | 0.016252040403589 | 0.014256175792622 | 0.008981390749352 | 82 |
IV. Investment Strategy Comparison: WAM vs ZIL
Long-term vs Short-term Investment Strategies
- WAM: Suitable for investors focused on gaming ecosystems and play-to-earn potential
- ZIL: Suitable for investors seeking blockchain infrastructure and scalability solutions
Risk Management and Asset Allocation
- Conservative investors: WAM: 20% vs ZIL: 80%
- Aggressive investors: WAM: 40% vs ZIL: 60%
- Hedging tools: Stablecoin allocation, options, cross-currency portfolios
V. Potential Risk Comparison
Market Risk
- WAM: Higher volatility due to smaller market cap and gaming sector dependencies
- ZIL: Susceptible to overall blockchain market trends and competition from other smart contract platforms
Technical Risk
- WAM: Scalability, network stability
- ZIL: Hash power concentration, potential security vulnerabilities
Regulatory Risk
- Global regulatory policies may have differing impacts on both assets
VI. Conclusion: Which Is the Better Buy?
📌 Investment Value Summary:
- WAM advantages: Niche market in play-to-earn gaming, potential for rapid growth
- ZIL advantages: Established blockchain platform, higher liquidity, broader ecosystem
✅ Investment Advice:
- Novice investors: Consider a smaller allocation to ZIL as part of a diversified portfolio
- Experienced investors: Balanced approach with both WAM and ZIL, adjusting based on risk tolerance
- Institutional investors: Focus on ZIL for its more established market presence and liquidity
⚠️ Risk Warning: The cryptocurrency market is highly volatile, and this article does not constitute investment advice. None
VII. FAQ
Q1: What are the main differences between WAM and ZIL? A: WAM is focused on play-to-earn gaming platforms, launched in 2021, while ZIL is a high-throughput public blockchain platform introduced in 2018. WAM has a smaller market cap and is more volatile, while ZIL has a larger ecosystem and higher liquidity.
Q2: Which cryptocurrency has shown better price performance historically? A: ZIL reached its all-time high of $0.255376 on May 7, 2021, while WAM's all-time high was $0.194038 on December 19, 2021. However, both have experienced significant drops from their peaks, with WAM showing higher volatility due to its smaller market cap.
Q3: How do the short-term price predictions for WAM and ZIL compare? A: For 2025, WAM's conservative estimate ranges from $0.0006608 to $0.000944, with an optimistic range of $0.000944 to $0.00102896. ZIL's conservative estimate for the same year is $0.00555007 to $0.007817, with an optimistic range of $0.007817 to $0.00961491.
Q4: What are the key factors influencing the long-term value of WAM and ZIL? A: Key factors include institutional adoption, technological development, ecosystem growth, macroeconomic conditions, and regulatory attitudes. ZIL may have an advantage in terms of established ecosystem and institutional adoption, while WAM's potential lies in the growing play-to-earn gaming sector.
Q5: How should investors allocate their portfolio between WAM and ZIL? A: Conservative investors might consider allocating 20% to WAM and 80% to ZIL, while aggressive investors could opt for 40% WAM and 60% ZIL. However, individual allocations should be based on personal risk tolerance and investment goals.
Q6: What are the main risks associated with investing in WAM and ZIL? A: Both face market risks related to cryptocurrency volatility. WAM has higher volatility due to its smaller market cap and gaming sector dependencies. ZIL faces competition from other smart contract platforms. Both also face technical risks related to scalability and security, as well as potential regulatory risks.
Q7: Which cryptocurrency might be more suitable for different types of investors? A: Novice investors might consider a smaller allocation to ZIL as part of a diversified portfolio. Experienced investors could take a balanced approach with both WAM and ZIL. Institutional investors may focus more on ZIL due to its established market presence and higher liquidity.
Share
Content
Introduction: Investment Comparison between WAM and ZIL
I. Price History Comparison and Current Market Status
Investment Value Core Factors: WAM vs ZIL
III. 2025-2030 Price Prediction: WAM vs ZIL
IV. Investment Strategy Comparison: WAM vs ZIL
V. Potential Risk Comparison
VI. Conclusion: Which Is the Better Buy?
VII. FAQ

