As speculation wanes and infrastructure takes center stage, the NFT market will pivot to a more pragmatic approach in 2025.
NFT trading activity rebounded in Q3 2025, reversing a prolonged post-hype decline.
After two years of market contraction and shifting narratives, on-chain markets have established new momentum. Growth is now driven by cost-effective infrastructure, loyalty programs, and sports-linked assets—not blue-chip collectibles or speculative artwork.
Trading for these assets is fundamentally about utility, not status.
NFT Volumes Recover, Sales Hit All-Time Highs
Ethereum’s scaling upgrades are pushing trading activity to L2s, while Solana’s high throughput and compression tech secure its market position. Bitcoin Ordinals have emerged as a culture of collectibles tied to fluctuating transaction fees. The NFT sector now prioritizes low-cost infrastructure and practical use cases.
Market growth is increasingly shaped by transaction fees and distribution networks, not profile picture NFTs.
The Dencun upgrade reshaped the economics: Ethereum’s EIP-4844 drastically cut rollup data costs, dropping L2 transaction fees to just a few cents and enabling gasless or sponsored minting for mainstream users.
L2 fees have declined by over 90%, a shift visible in minting activity and fueling Base’s rise as a key distribution hub.
Solana’s compression tech enables mass NFT issuance for loyalty and access-control applications.
Deploying 10 million compressed NFTs costs approximately 7.7 SOL, and even under heavy network load, median transaction fees stay near $0.003.
Bitcoin Ordinals have carved out an independent lane, tightly linked to mempool cycles and miner revenue. As of February 2025, more than 80 million Ordinals had been inscribed, ranking among the top three for historical NFT sales.
Demand Rebounds, but Risks Persist
DappRadar reports that NFT trading volume nearly doubled quarter-over-quarter in Q3 2025, reaching $1.58 billion, with a record-breaking 18.1 million transactions.
Sports NFTs led the surge, with trading volume up 337% QoQ to $71.1 million. Their cyclical utility, access benefits, and loyalty rewards uncouple spending behavior from floor prices.
The summer market saw a rapid bounce before cooling: CryptoSlam shows $574 million in July 2025 sales—the year’s second-highest—followed by a roughly 25% drop in September as crypto market risk appetite receded.
This confirms a shift to lower average prices. Even as user counts and utility-driven categories remain steady, total NFT trading tracks broader crypto market swings.
Distribution channels have become critical. Wallets with built-in key functions and fee sponsorship eliminate onboarding friction that previously blocked users.
Coinbase Smart Wallet offers key-based login and gas sponsorship; Phantom, with 15 million monthly active users as of January 2025, powers traffic for mobile and social minting.
Distribution reach is essential in blockchain ecosystems where culture and social engagement reinforce each other—Base exemplifies this trend.
This year, Base has outperformed Solana in some NFT trading metrics, propelled by low-cost minting, batch cadence from Zora, and distribution via Farcaster.
Creators now model distribution data to select platforms before tailoring fee strategies.
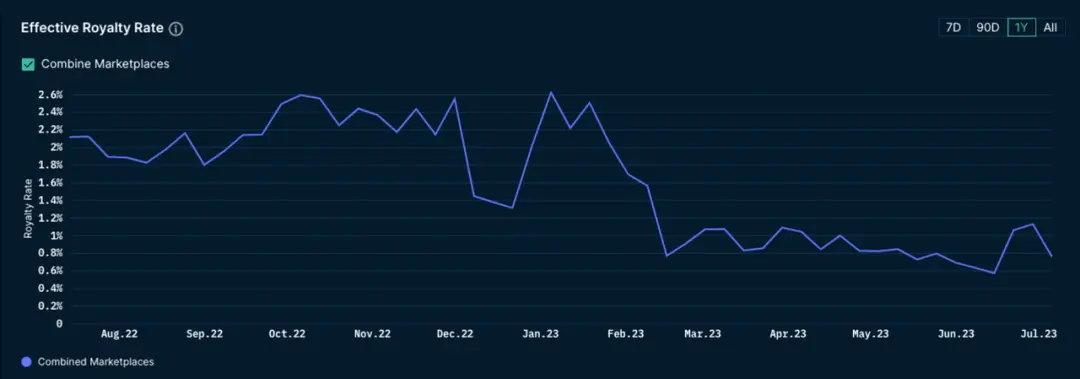
Royalties Shift Away from Core Revenue
Post-2022 peak, competition among marketplaces made royalties optional in most venues, causing a significant drop in creator royalty income.
Nansen reports royalties fell to a two-year low in 2023 and have yet to recover.
Conversely, platforms enforcing royalties are on the rise. Late 2023 saw Magic Eden and Yuga Labs launch an Ethereum marketplace with mandatory royalties, creating protected channels for major brands.
The market now features two distinct tracks: Open markets rely on low fees, primary sales, IP partnerships, and retail integration for creator profits. Closed ecosystems enforce royalties by contract, supporting premium NFT launches.
Incentive-driven capital flows keep marketplace share in flux.
On Solana, Magic Eden and Tensor form a duopoly, each swinging between 40% and 60% market share as rewards and protocol design change.
This isn’t structural change—market share charts may hint at regime shifts, but they eventually revert to the mean.
Key lesson for creators: Negotiate your distribution plan up front, not by defaulting to a single platform.
User Migration Maps Short-Term Trajectories
Sports, ticketing, and loyalty programs scale because their benefits are cyclical and repeatable, with blockchain features integrated into established ticketing and e-commerce processes.
In Q3 2025, DappRadar shows sports NFT transaction growth outpacing the broader market—even without full-season or league-level partnerships.
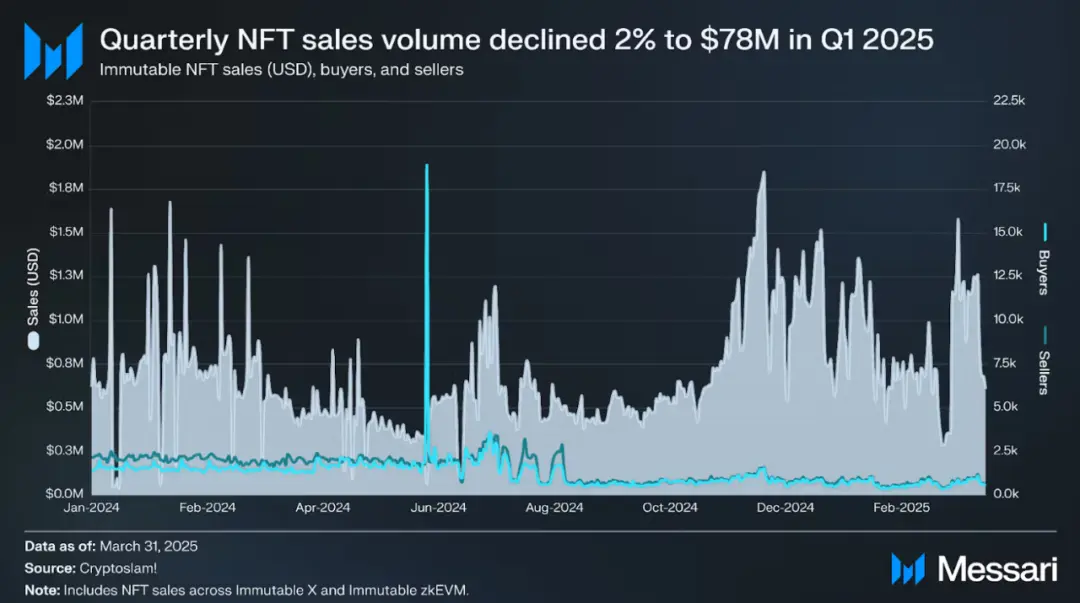
Gaming growth is more steady. Messari finds Immutable’s zkEVM structure and real-time data underpin continuous transaction growth; its design—Ethereum security, L2 user experience—fits asset custody and ongoing secondary market fees.
IP and licensing deals are a key bridge for NFTs moving from JPEG collectibles to consumer channels: Pudgy Penguins landed in over 3,000 Walmart stores, building a pipeline from NFT to physical retail and licensing revenue.
For creators, network costs and user experience are now transparent:
Ethereum L1 dominates provenance and high-value art, with volatile gas fees and optional royalties;
Post-Dencun, Ethereum L2s (like Base) offer fees in the cents, support gasless and sponsored transactions, and provide social distribution via Base and Farcaster;
Solana’s compression keeps mass NFT issuance affordable, backed by mobile-first wallet reach;
Bitcoin Ordinals focus on rare collectibles, with fee increases as a market trait—not a flaw.
Macro Landscape Shifts
Annualized NFT trading for 2025 is projected at $5–6.5 billion, with H1 average prices at $80–$100—setting a baseline for the coming year.
Based on CryptoSlam’s monthly data and DappRadar’s breakdown:
Bear scenario: If crypto stagnates and average prices drop, total NFT volume could fall to $4–5 billion, with fee-sensitive apps clustered on Solana and Ethereum L2, Ethereum L1 art markets stable, and Ordinals fluctuating with Bitcoin fee cycles.
Baseline: If embedded wallets and social minting scale, sports and live events expand across seasons, and brands test new releases on enforced royalty platforms, total volume could reach $6–9 billion.
Bull case: If mobile distribution surges (Base and key login streamline minting, Phantom hits 20 million MAUs, ticketing pilots go mainstream, and gaming assets sustain active trading), total volume could hit $10–14 billion.
Across all scenarios, Ethereum L2 and Solana will capture dominant share; Ethereum L1 will serve niche segments, and Bitcoin Ordinals will remain a stable rare collectibles lane.
Six Critical Variables Drive Growth
1. Wallet UX and distribution: Measure key adoption rates, sponsored fee usage, and Phantom/Coinbase Smart Wallet MAUs.
2. Mandatory royalty coverage: Shapes high-end NFT launches, including OpenSea’s policy direction and the vitality of creator-focused platforms on Ethereum.
3. Scale of sports/ticketing partnerships: From pilots to full-season deals, converting one-off sales into recurring revenue.
4. Base and Zora minting cadence: Track monthly mint volume, Base’s share of overall NFT trading, and Farcaster Frames’ effects to gauge persistent social distribution.
5. Solana compression adoption: Monitor compressed NFT mint volume and per-million asset costs to see if loyalty/media apps move from pilots to routine.
6. Bitcoin fee cycles: Their interplay with Ordinals and Runes, shifting with mempool congestion, will keep impacting collectible pricing.
Two risks remain. Wash trading and spam distort GMV and sales figures, so average sale price and dashboards with organic filters are safer indicators.
Marketplace incentives can mislead market share charts (really just airdrop cycle effects), especially in Solana’s dual oligopoly.
Creators should plan for this volatility from the outset.
Another operational constraint is income design: With royalties mostly optional in open markets, primary sales, IP licensing, and retail partnerships carry more revenue weight.
Enforced-royalty closed platforms only offer premium channels to select brands, so most creators have limited access.
Industry Shift: From "Endgame" to "Migration"
The JPEG speculation era has ended. NFT infrastructure costs have plummeted, and use cases have shifted toward ticketing, sports, gaming, and IP—with wallets and distribution networks integrating into familiar user experiences.
For blue-chip NFTs like Bored Ape Yacht Club, investors who paid six figures for AWS-hosted JPEGs remain at risk.
A 2021 Ape NFT sold for over 74 ETH now trades at just 9 ETH—an 87% loss in three years.
The NFT speculative boom may be history, but whether the underlying tech will prove out in real-world utility remains to be seen.
The signs are promising, but that optimism excludes those stuck at peak prices.
Q3 2025 closed with $1.58 billion in NFT volume and 18.1 million transactions, as the market continues its shift toward utility-driven structures.
Statement:
- This article is reprinted from [TechFlow] and is copyrighted by the original author [Blockchain Knight]. For any reprint objections, please contact the Gate Learn team, which will respond promptly according to established procedures.
- Disclaimer: The opinions and views expressed are solely those of the author and do not constitute investment advice.
- Other translations of this article are provided by the Gate Learn team. Do not copy, distribute, or plagiarize translated content unless Gate is referenced.
Share


Related Articles

The Future of Cross-Chain Bridges: Full-Chain Interoperability Becomes Inevitable, Liquidity Bridges Will Decline

Solana Need L2s And Appchains?

Sui: How are users leveraging its speed, security, & scalability?

Navigating the Zero Knowledge Landscape

What is Tronscan and How Can You Use it in 2025?
